50+ Push Notification Statistics for 2025

Push notifications may be the most effective marketing and communication channel available to brands today. But don’t take our word for it – take these push notification statistics as proof.
We’re about to share all the data you need to know about push notifications, from open and engagement rates, to push notifications’ impact on retention, to the difference emojis make.
If you’re on the fence about using push notifications for your brand, or simply curious about the state of push notifications in marketing today, keep reading for these amazing insights.
Learn more: the top Push Notification Services available today.
Average Push Notification Open Rate
Digital marketing agency Reckless puts the average open rate for push notifications at 20%.
This figure is the average push notification rate across all industries, for the study the agency conducted, which analyzed marketing campaigns from 22 different brands in a variety of industries.
The best-performing industries were Travel and Food & Beverage, while Fitness, Motor and Home & Decor all performed below average.
For all industries, this data put the open rate for push notifications well above that of email:

Keep in mind that this figure is quite high, and different sources have very different information.
Customer.io, for instance, places the average push notification open rate at around 4%.
The reason for wildly different figures in terms of push notification open rates is that an “open” for push notifications is somewhat vague.
It’s not always clear whether an open means the notification has been viewed in full on the lock screen, or that the app has been opened, or some other criteria.
Besides, for many push notifications, a user can get all the information they need right on their lock screen, without interacting with the notification or “opening” it. So a low open rate is not necessarily a cause for concern.
Push Notification Engagement Rates
It’s generally a better idea to look at the engagement generated by push notifications for gauging their effectiveness.
So how do push notifications stack up in terms of engagement?
Reckless’ study had the average clickthrough rate for push notifications at 28%.
For comparison, this again was well ahead of email in all industries looked at.

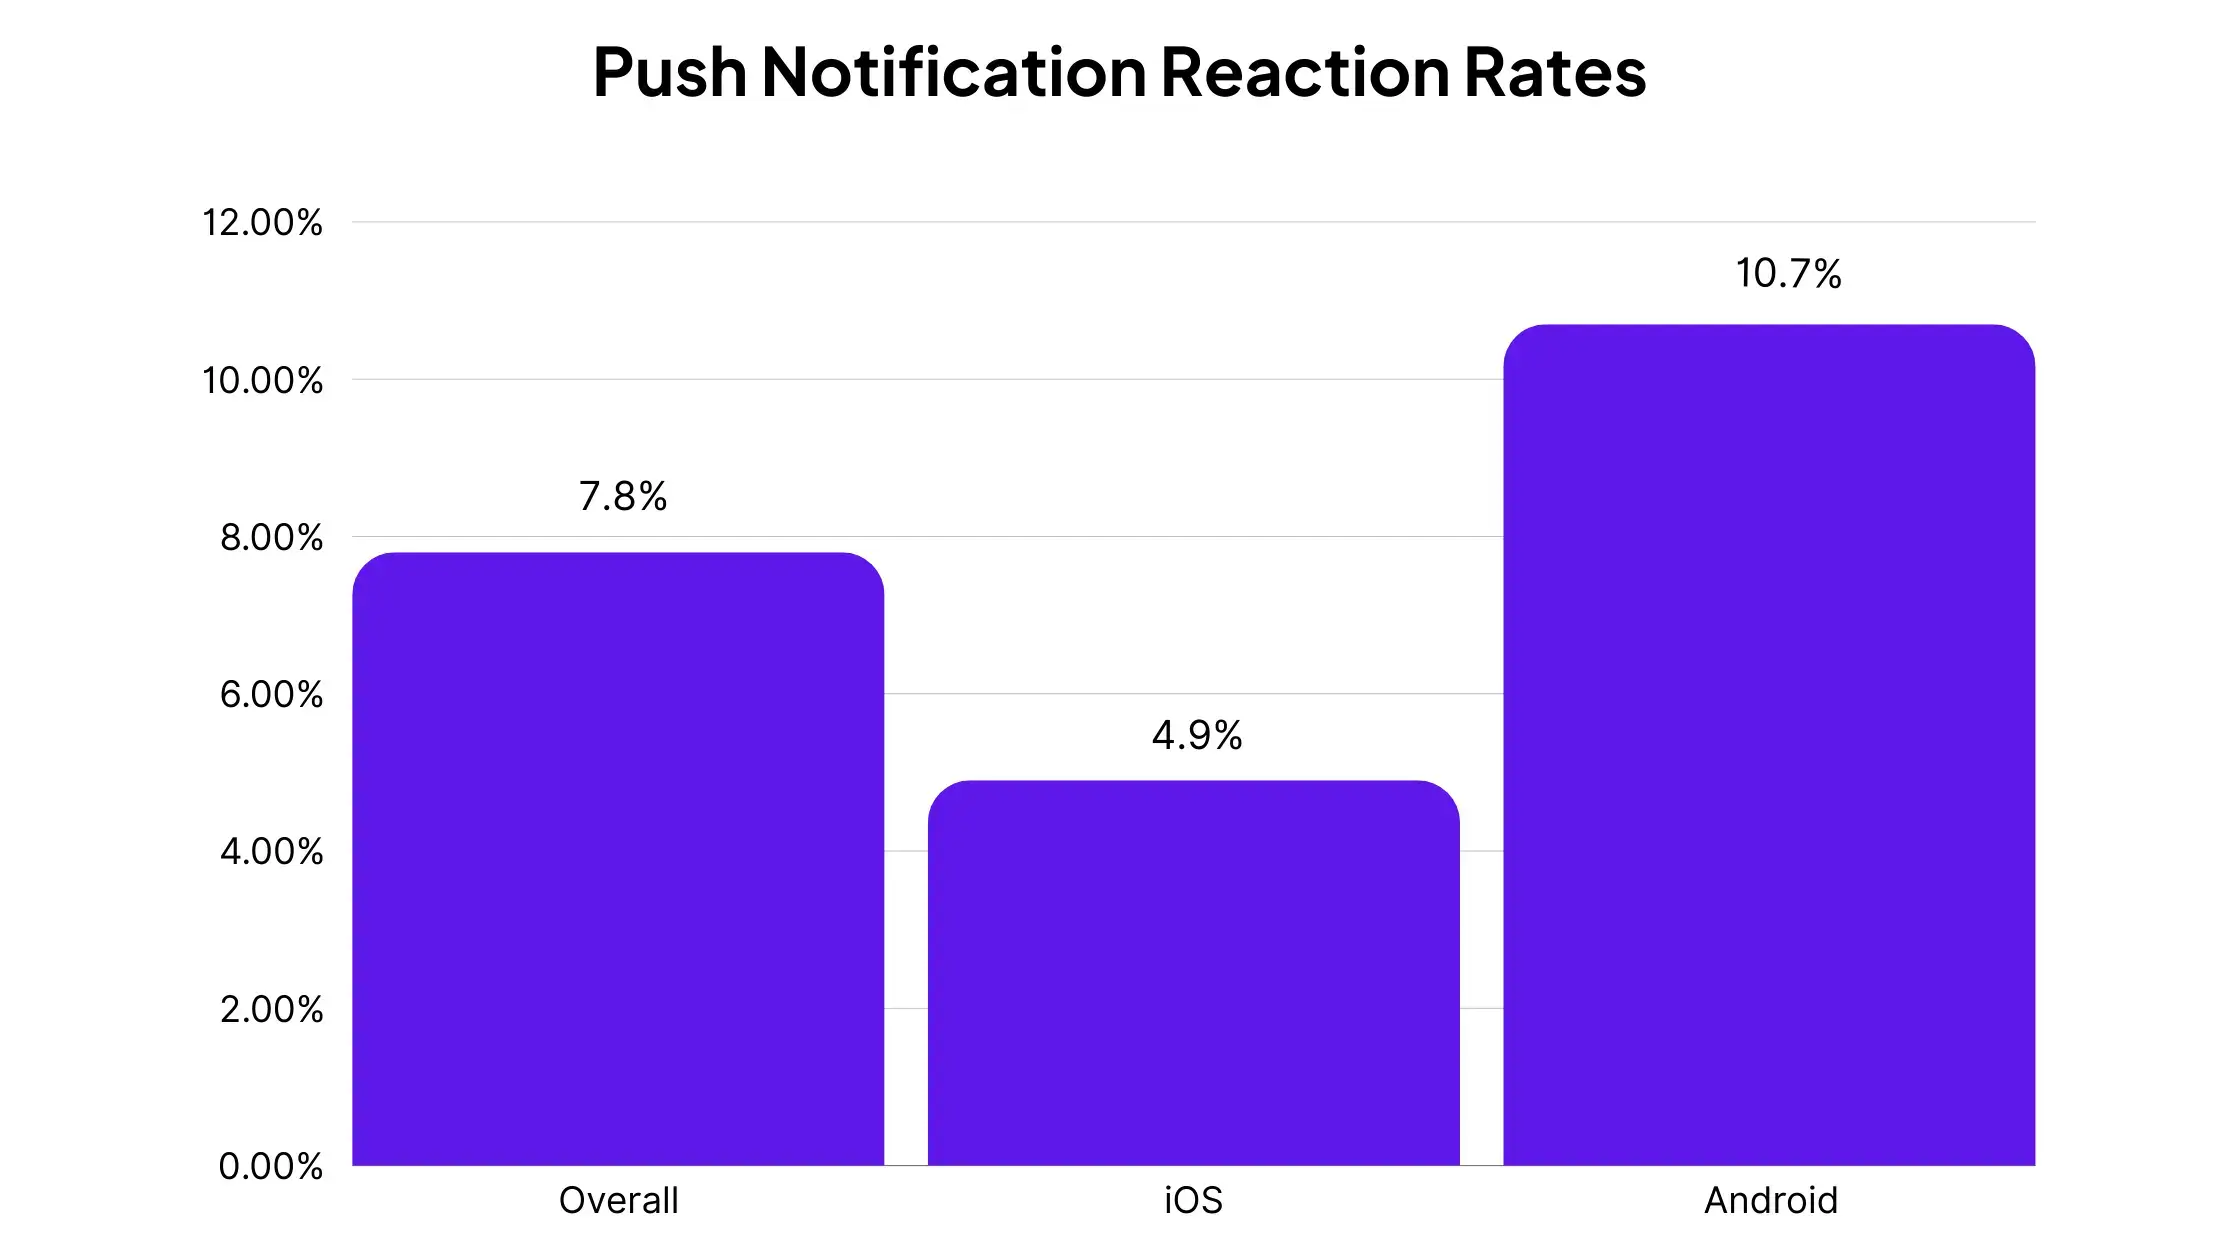
To dive deeper, Airship analyzed a total of 50 billion push notifications, and came up with some benchmarks for push notification reaction rate (judged as when a user clicks/taps on a push notification).
They found the average reaction rate for all push notifications was 7.8%.
For iOS, the average reaction rate drops to 4.9%, and 10.70% for Android.
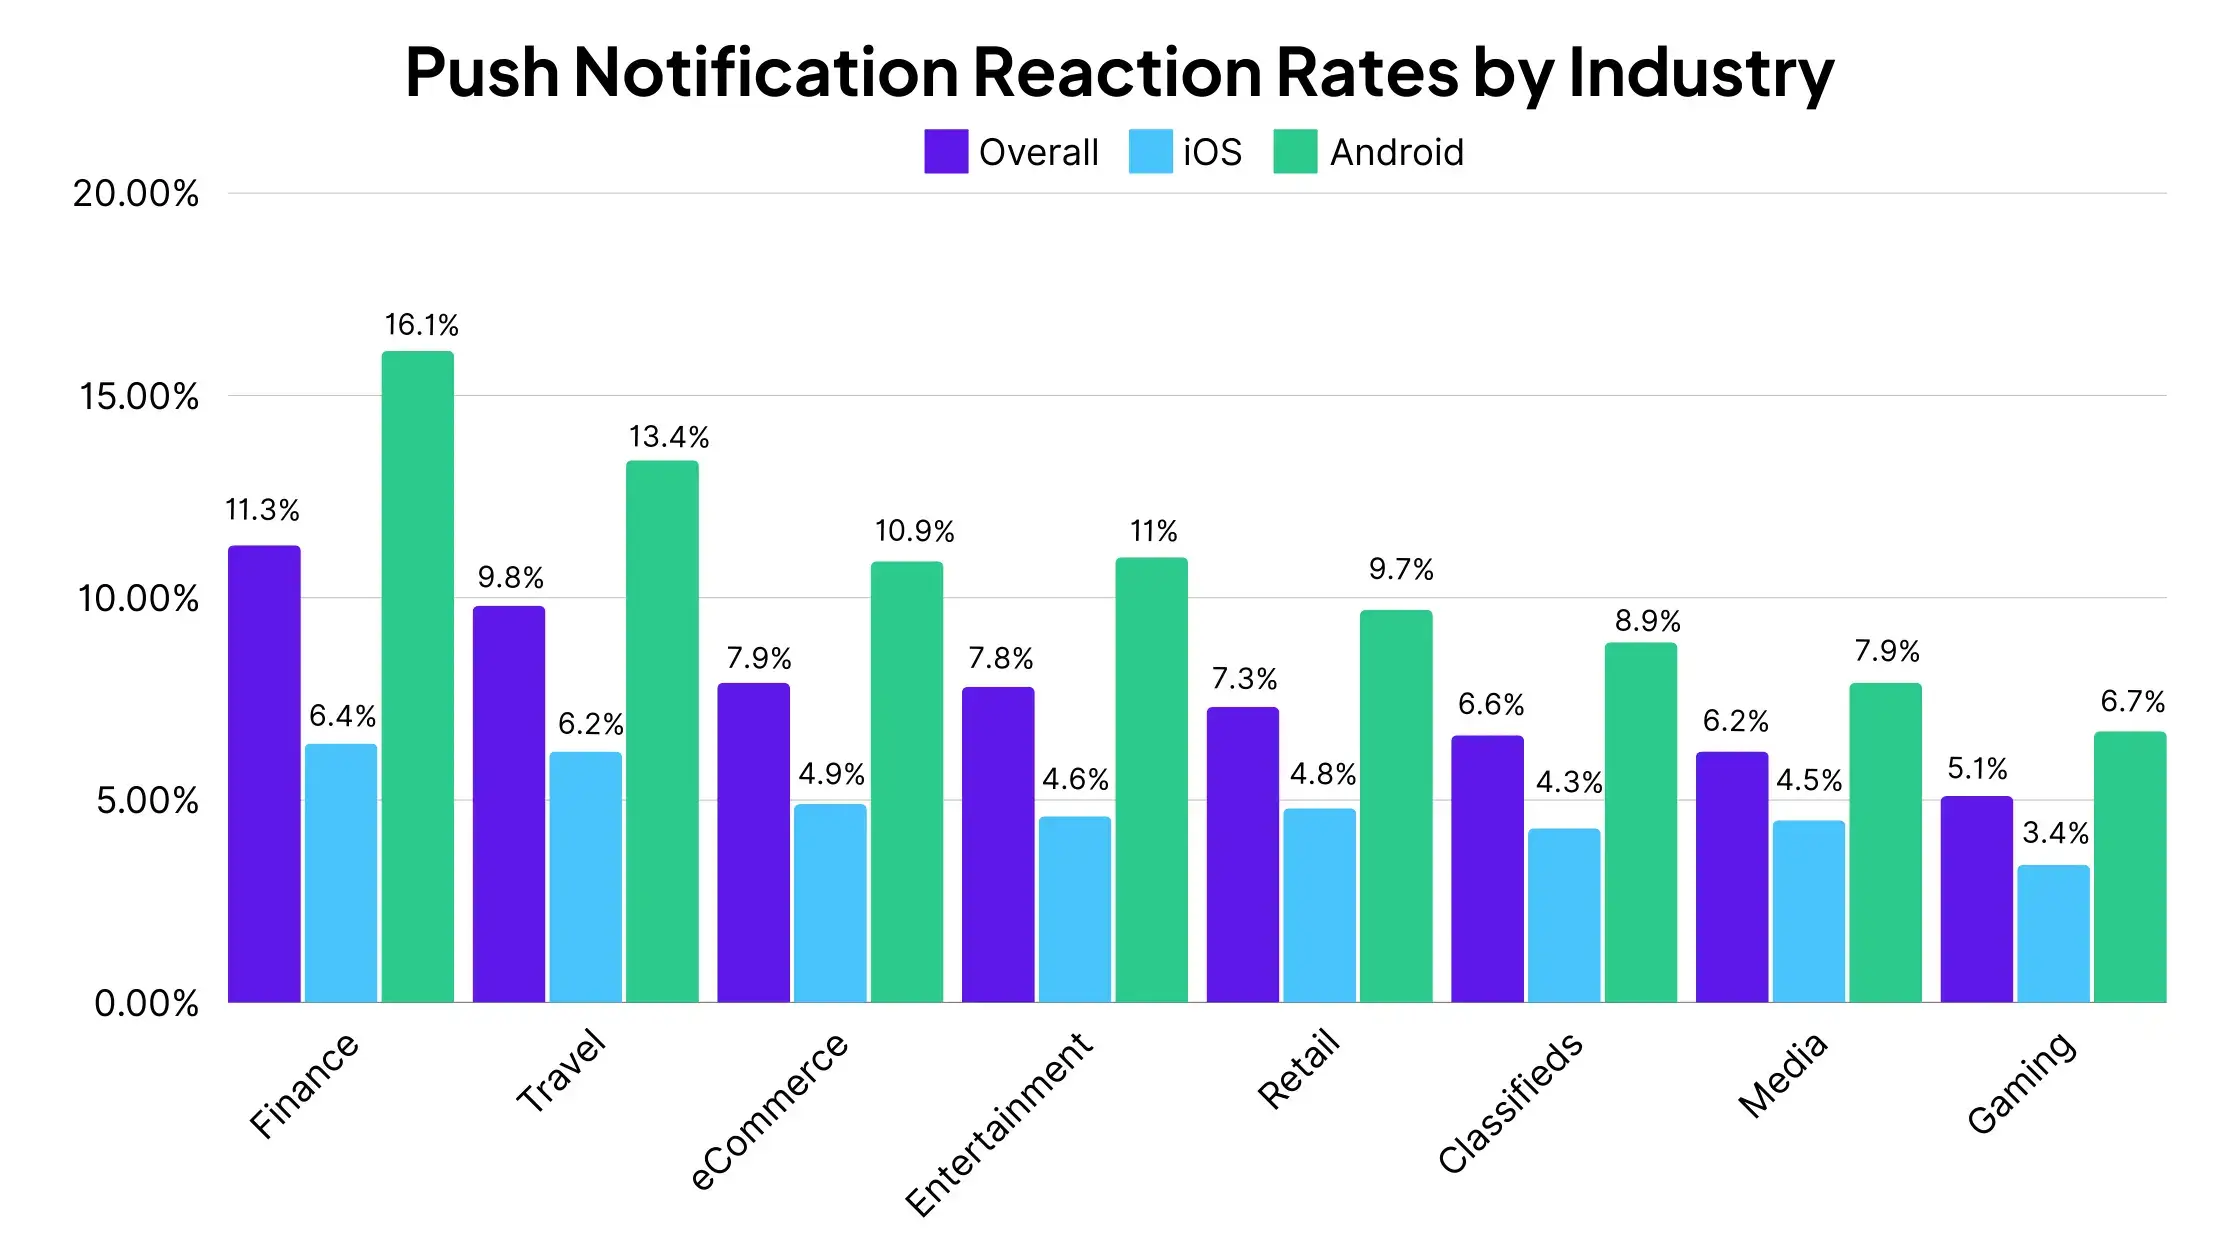
Here’s how the benchmarks vary in different industries:
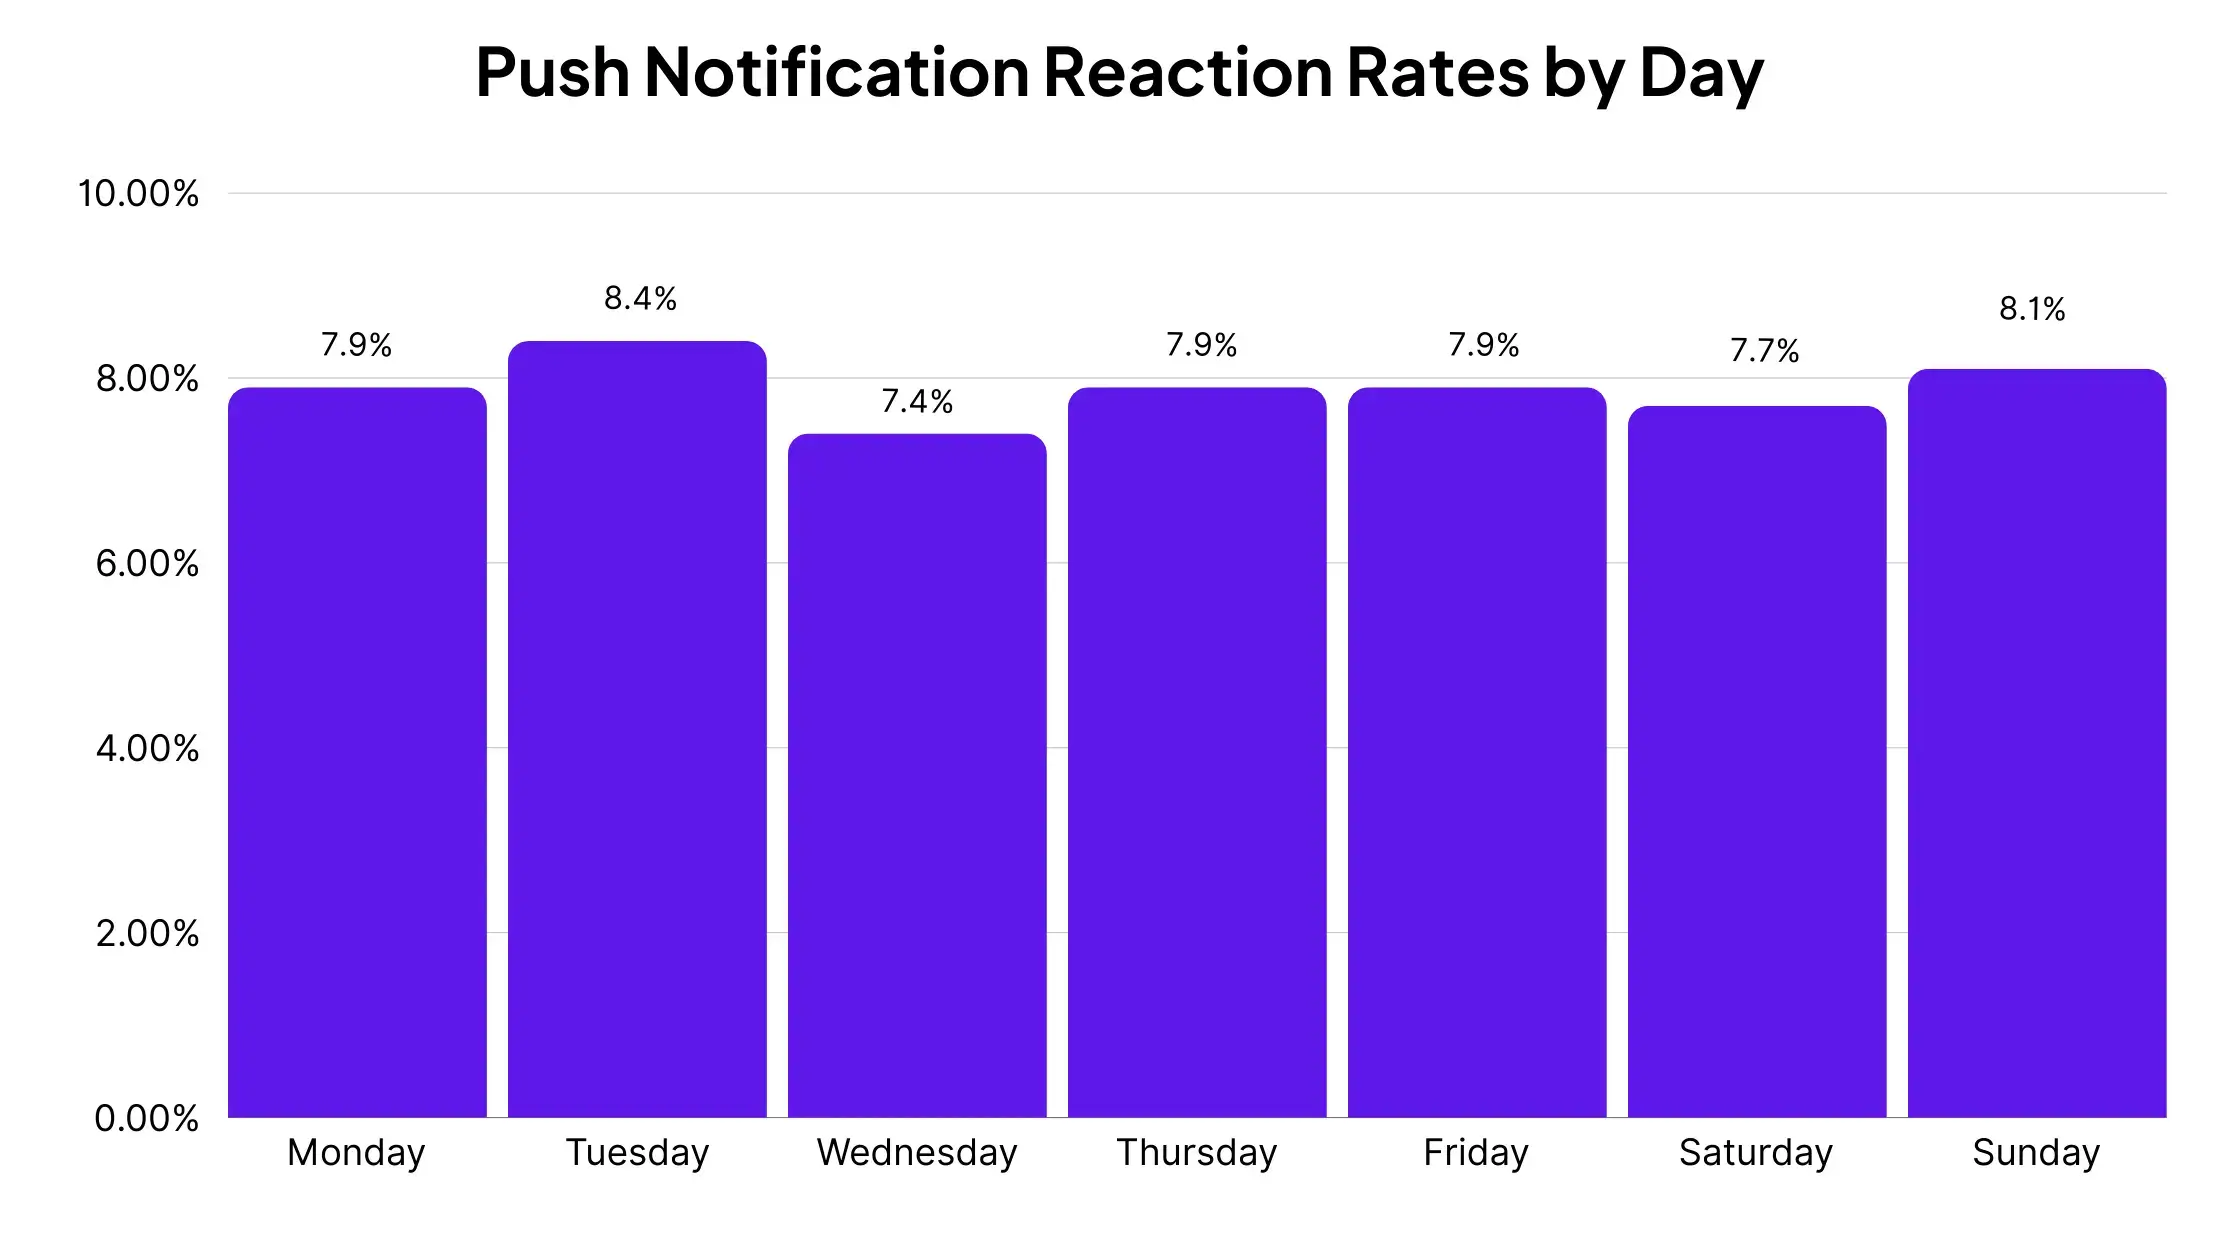
Reaction rates are fairly standard for each day of the week, but slightly higher on Tuesdays and Wednesdays:
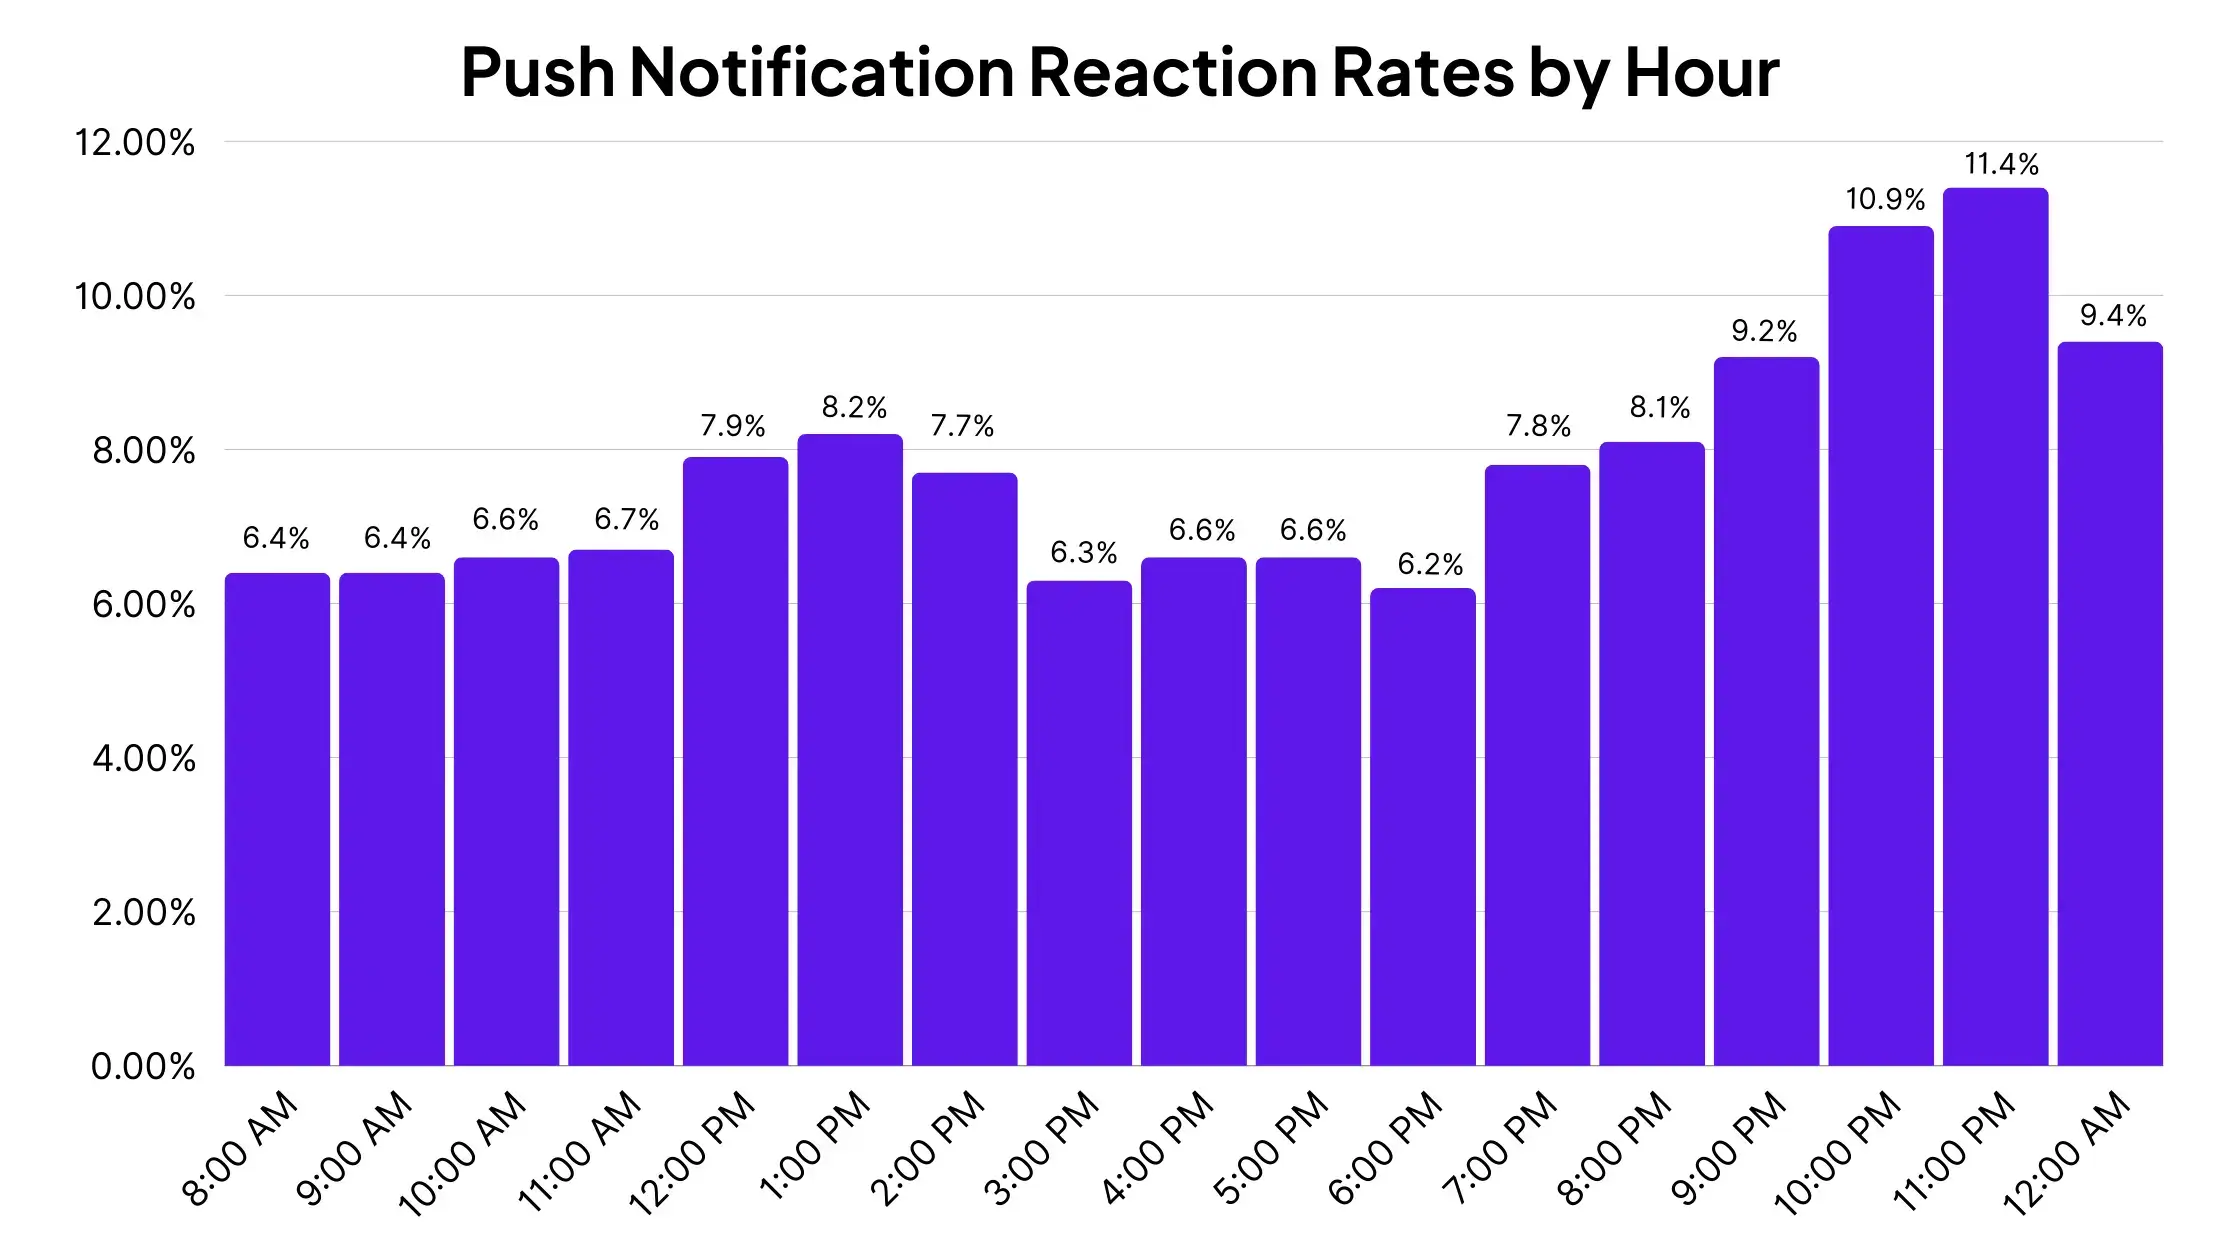
For the time of the day, reaction rates are lower in the morning and mid afternoon, and get higher towards the end of the day.
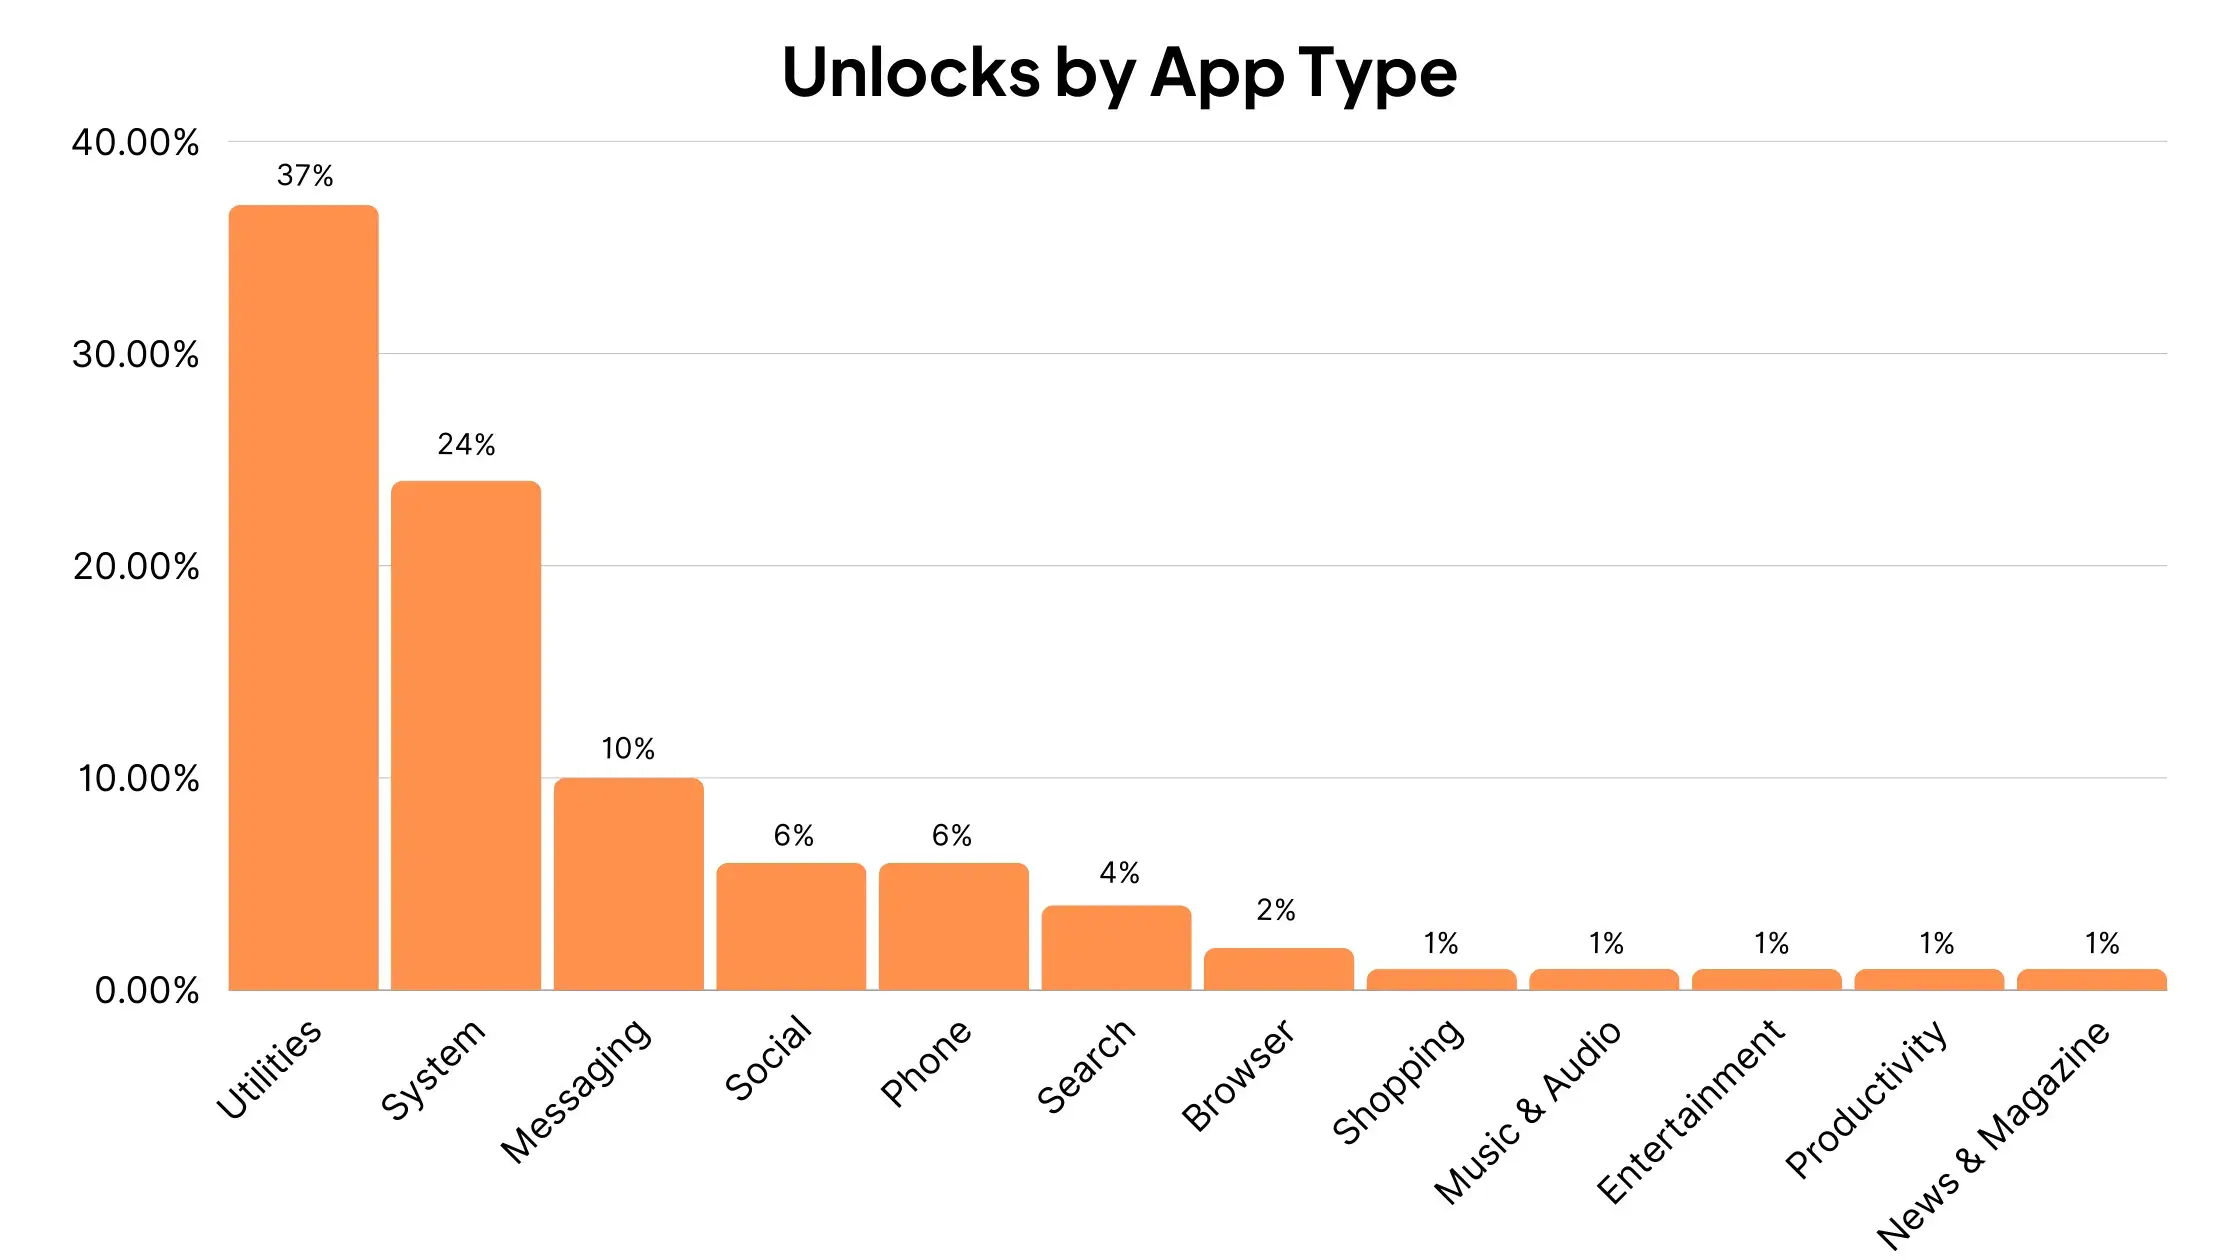
Statista also gives us data on the types of notifications that cause users to unlock their phone.
The majority of unlocks come as a result of push notifications from utility apps, followed by system notifications, and messaging apps:
Push Notification Opt-in Rates
One of the most important metrics for push notifications is opt-in rate.
It’s only possible to reach someone with a push notification if they have given permission for the app or website to do so.
That means opting in to push notifications (and not subsequently opting out).
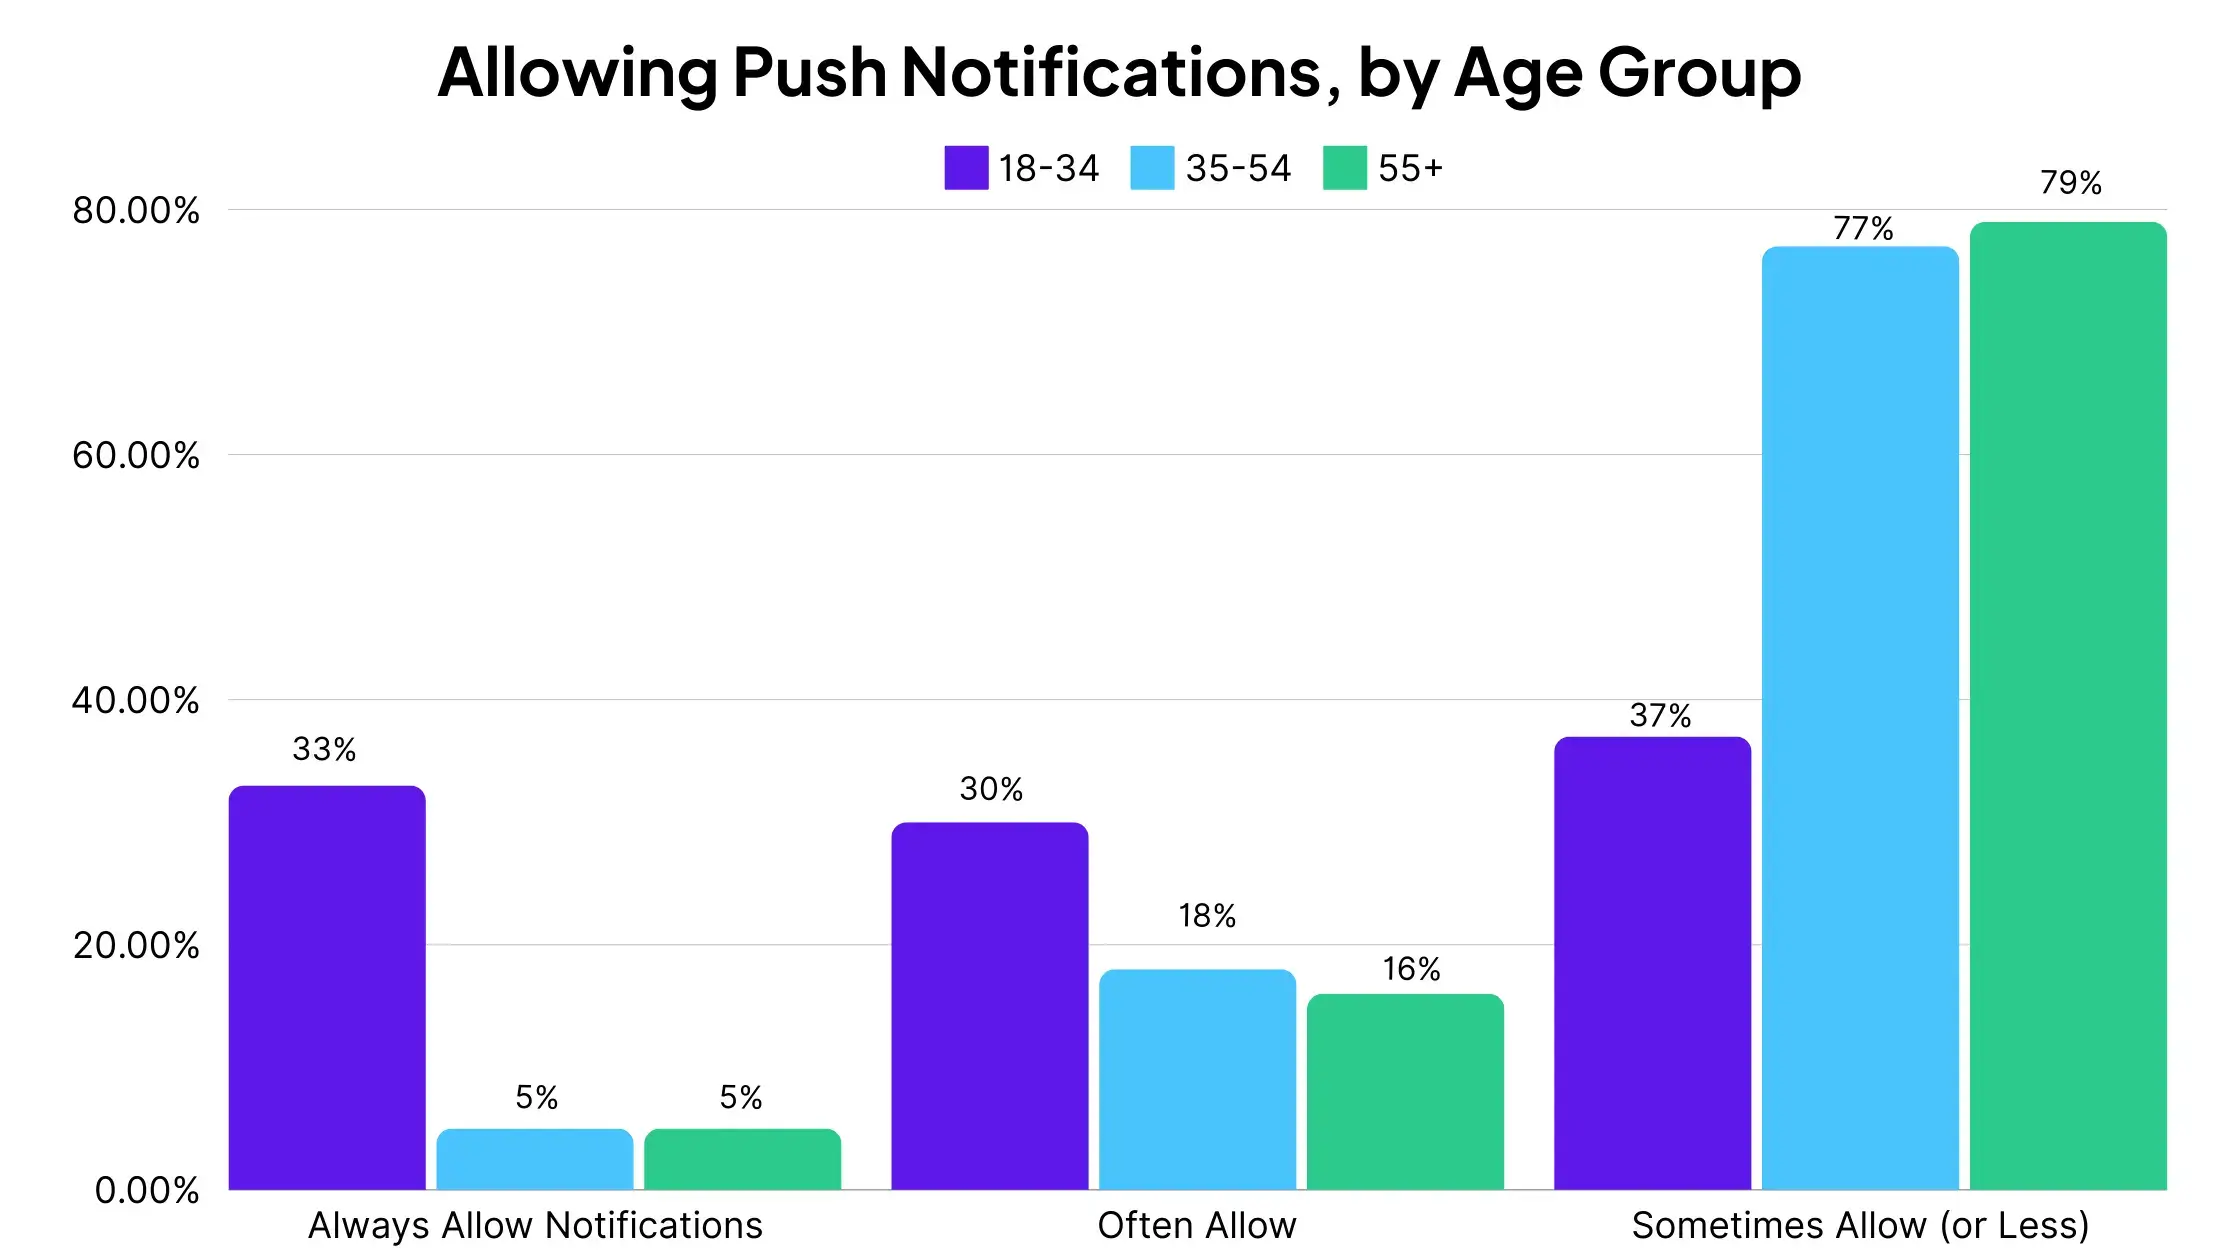
Survey answers indicate that younger age groups are much more likely to allow notifications.
- In the 18-34 age group, 33% always allow notifications, while 63% say they allow notifications “always” or “often”.
- 23% of 35-54 year olds allow notifications “always” or “often”, and 21% of 55+ year olds answer the same.
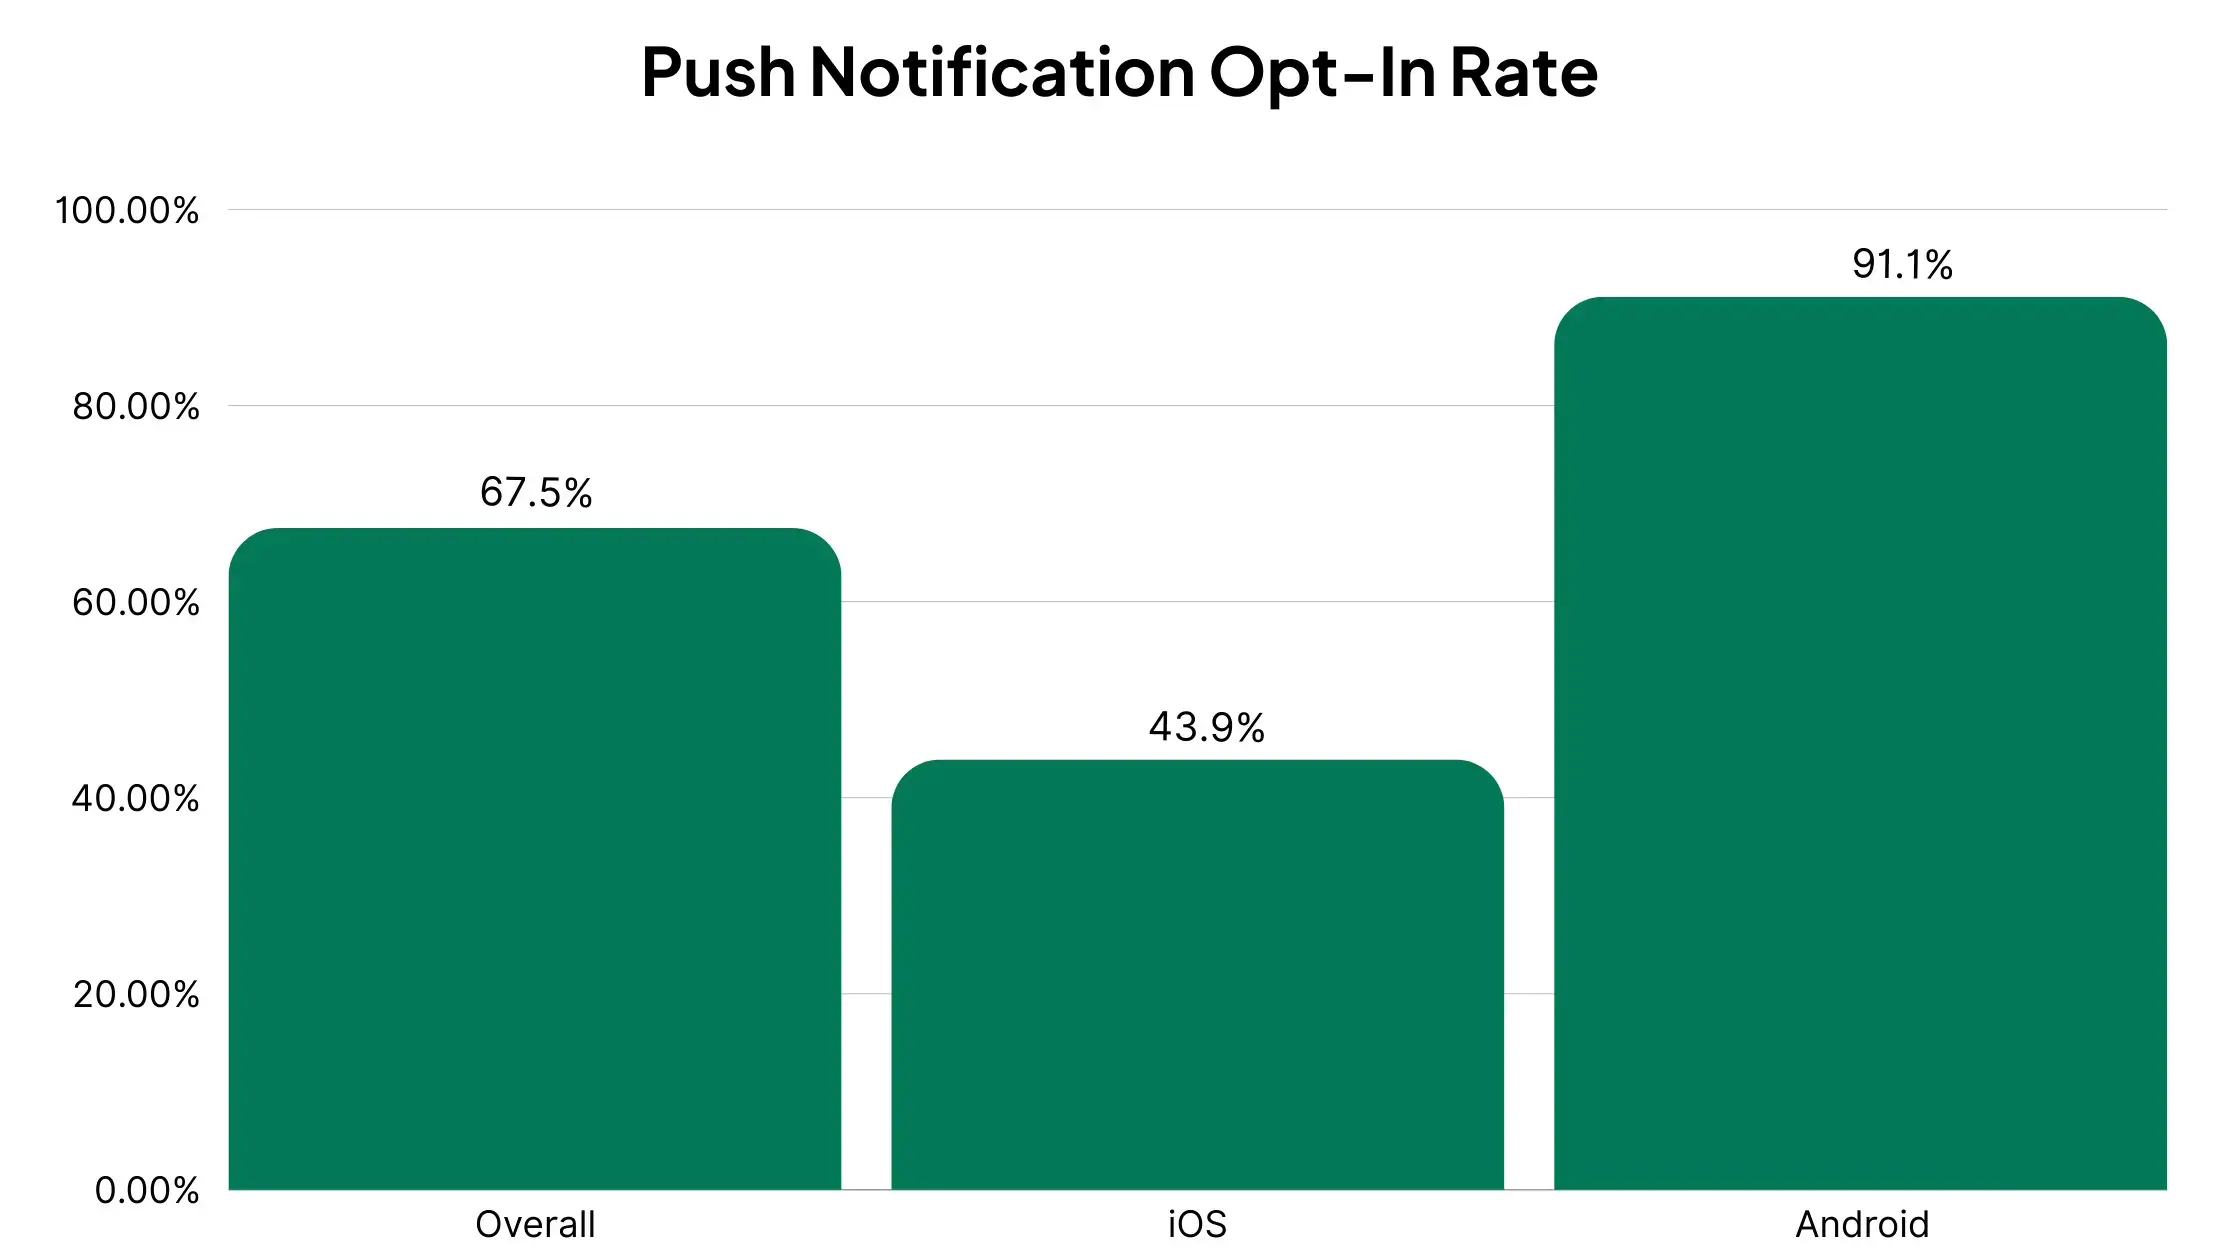
Data shows that the overall opt-in rate for mobile app push notifications is 67.5%.
And with iOS having a much bigger focus on user privacy, the average opt-in rate is significantly lower on Apple devices – 43.9%, compared to 91.1% for Android.
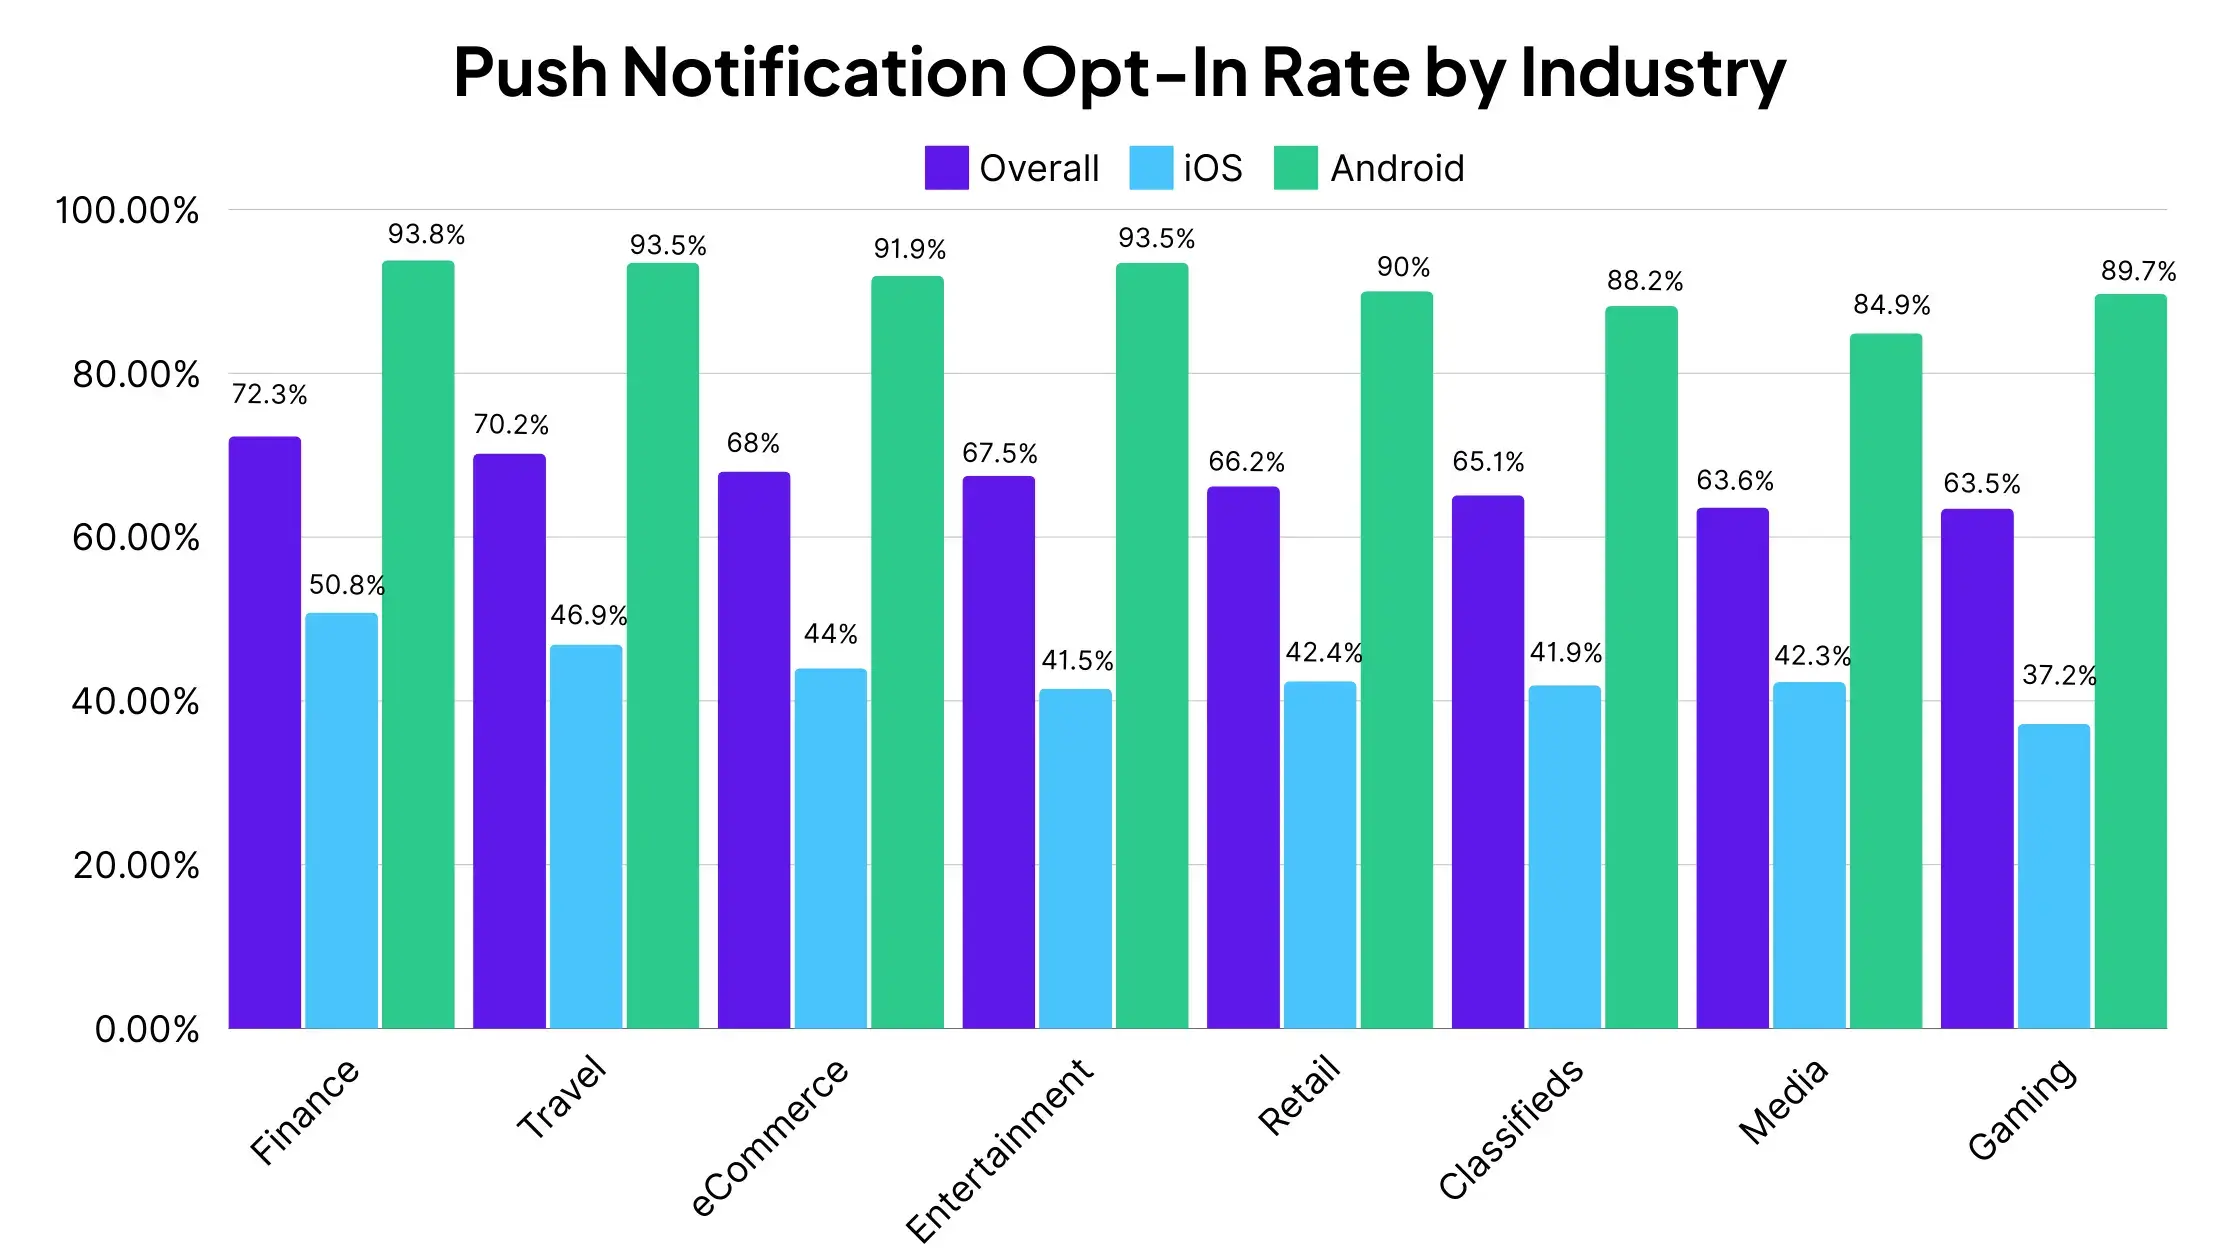
We can also see how push notification opt-in rate differs by industry.
- Finance and Travel apps have a higher average opt-in rate, at 72.3% and 70.2% respectively.
- Media and Gaming are at the lower end, with 63.6% and 63.5% opt-in rates.
- eCommerce apps have an average opt-in rate of 68%.
- Each industry follows a similar split in terms of OS, with Android apps having far higher opt-in rates than iOS apps.
The takeaway from this data is that opt-in rate is key, especially for iPhone users.
On average, less than half of these users will opt-in to push notifications – give them a good reason and a clear incentive to opt-in, and there’s significant upside to be had.
Push Notification Retention Statistics
Data shows that push notifications can be an amazingly effective way to boost retention in mobile apps.
Airship studied 63 million app users, across 1,500 apps, to see how push notifications influence whether or not a user remains active past 90 days.
The data found that push notifications were strongly correlated with retention.
- Retention rates were nearly 3x higher when users received one or more push notifications in their first 90 days using the app (compared to those who received zero notifications).
- 95% of users who opted in to push notifications, but didn’t receive a notification in the first 90 days, end up churning.
Interestingly, it also showed a strong correlation between push notification frequency and retention.
- App users who received one notification had 120% higher retention rates, compared to users who received zero notifications.
- Users who received weekly notifications had 440% higher retention rates than those who received zero.
- Users who received daily notifications (or more) had 820% higher retention rates than those who received zero.
- For retail apps, sending weekly push notifications resulted in 2-5x higher retention rates, and daily push notifications resulted in 3-6x higher retention rates.
How Often Should You Send Push Notifications?
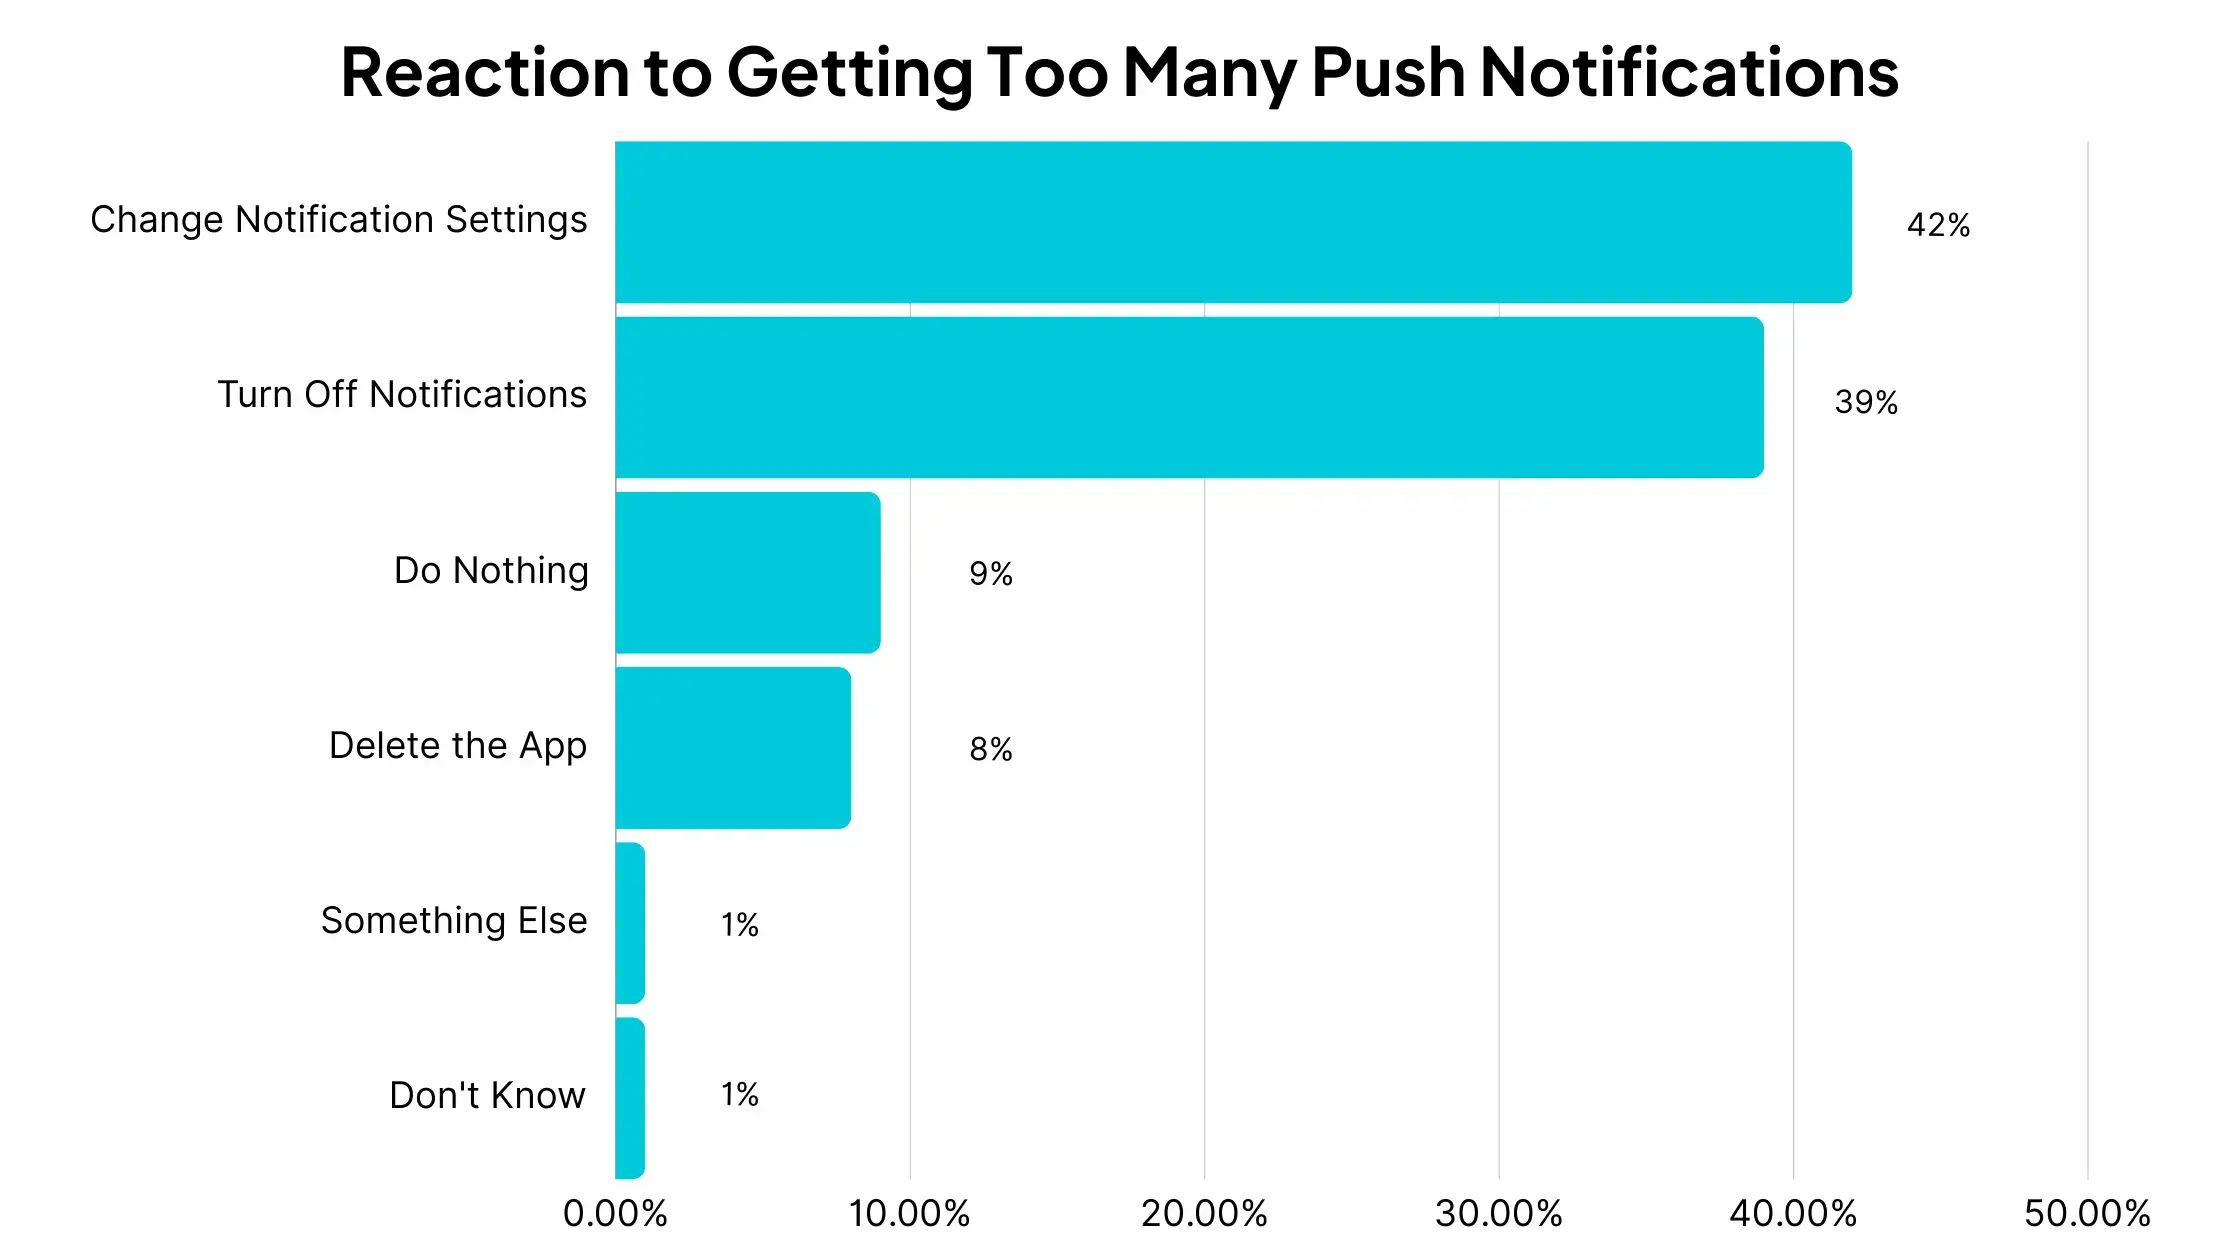
A large percentage of users will take action if they feel an app is messaging them too much.
- 42% will change their notification settings.
- 39% will turn off notifications.
- 8% will delete the app.
Just 9% of users say they will do nothing if they feel they’re getting too many push notifications.
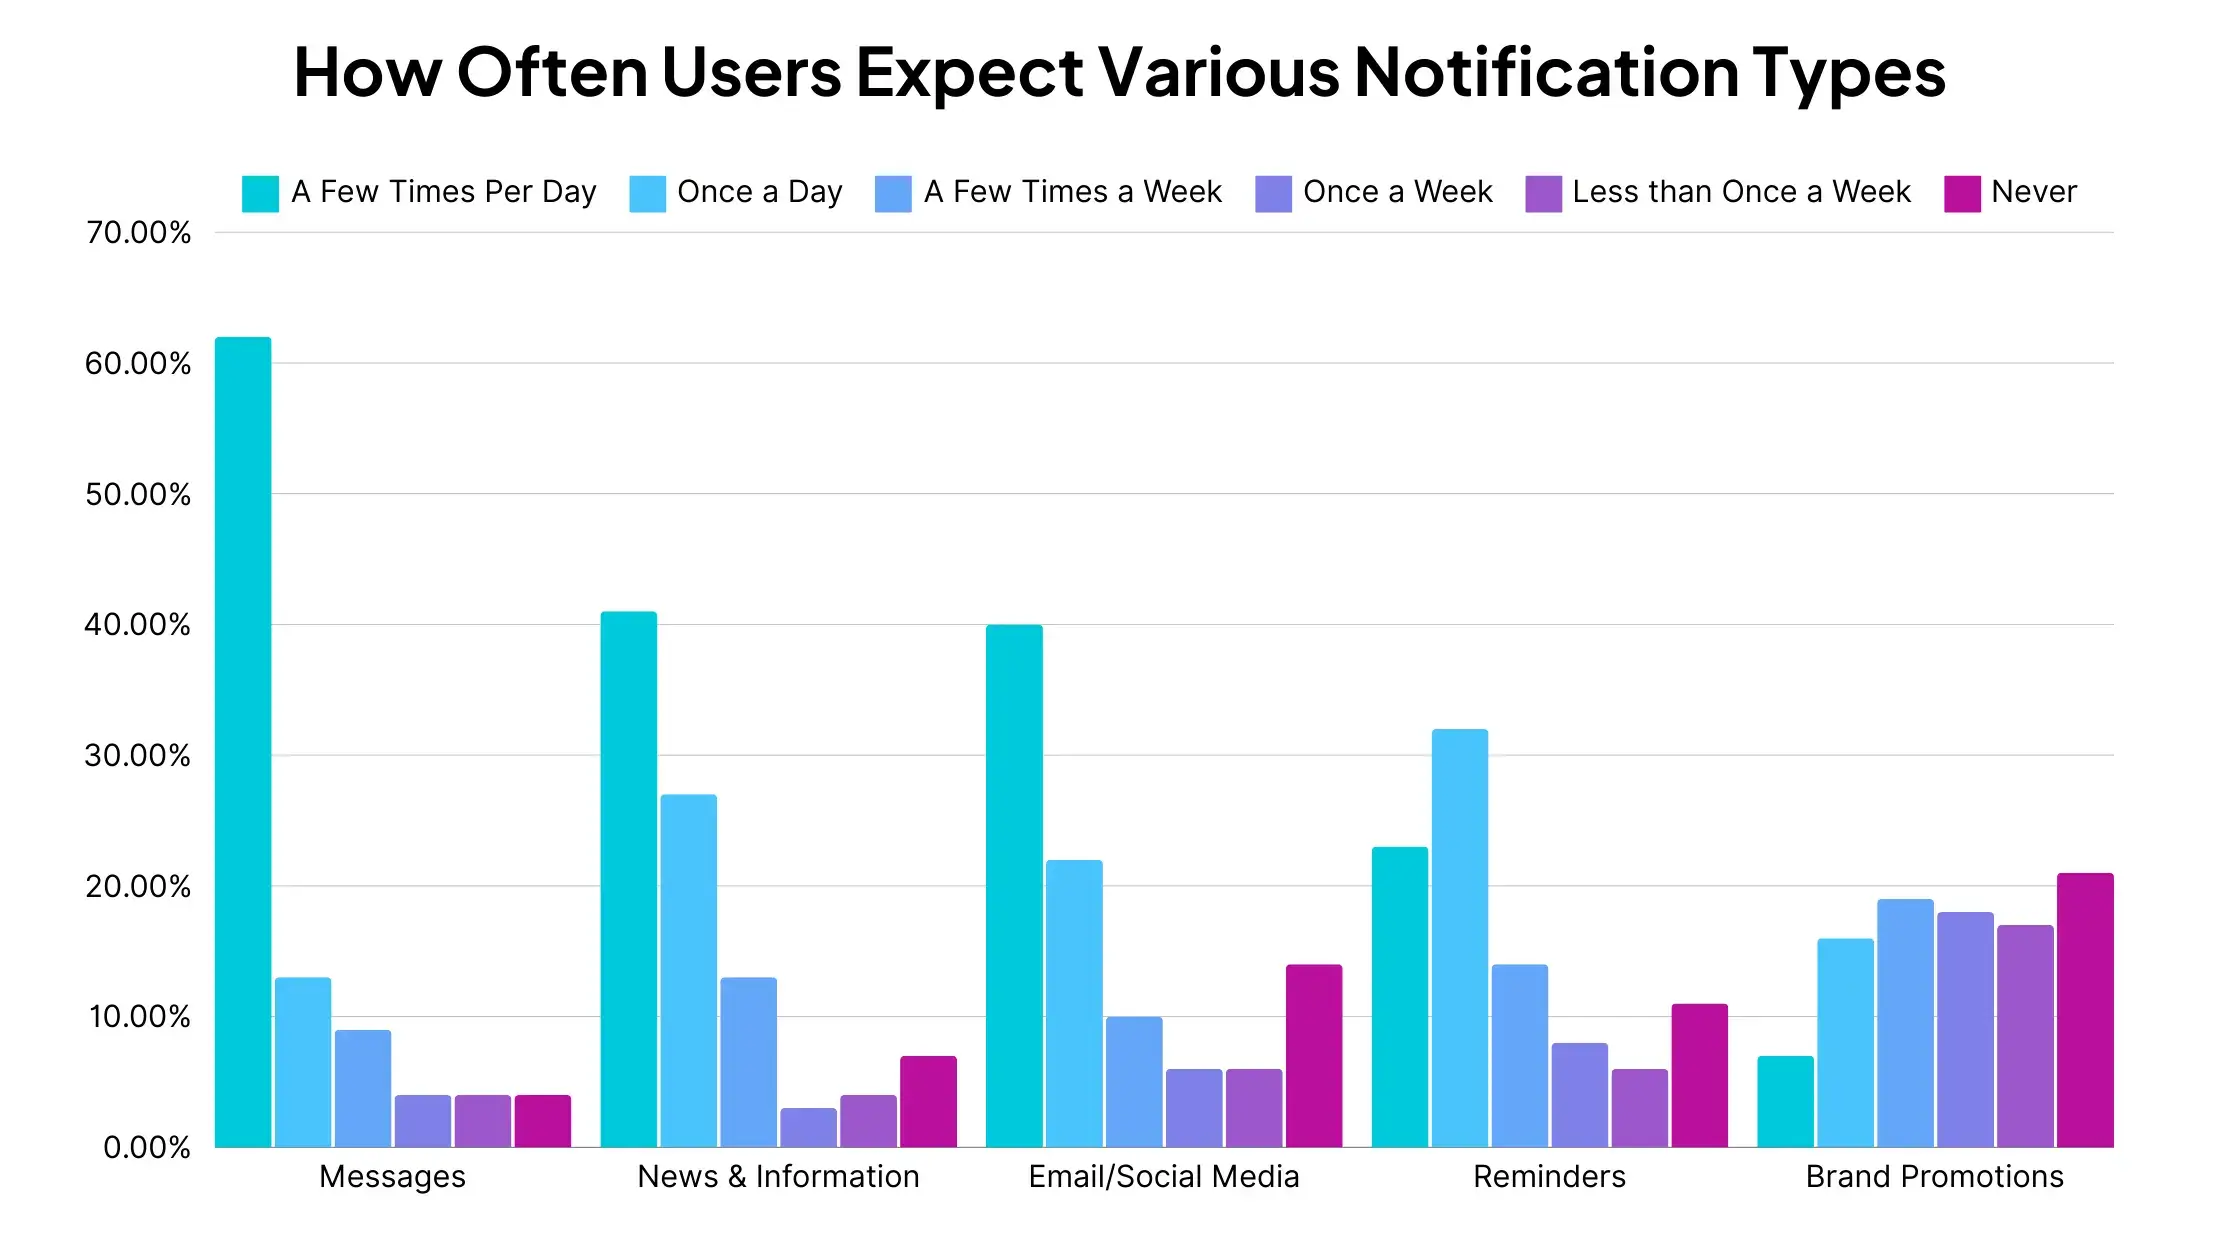
Yet many users say that they feel it’s appropriate to receive regular push notifications.
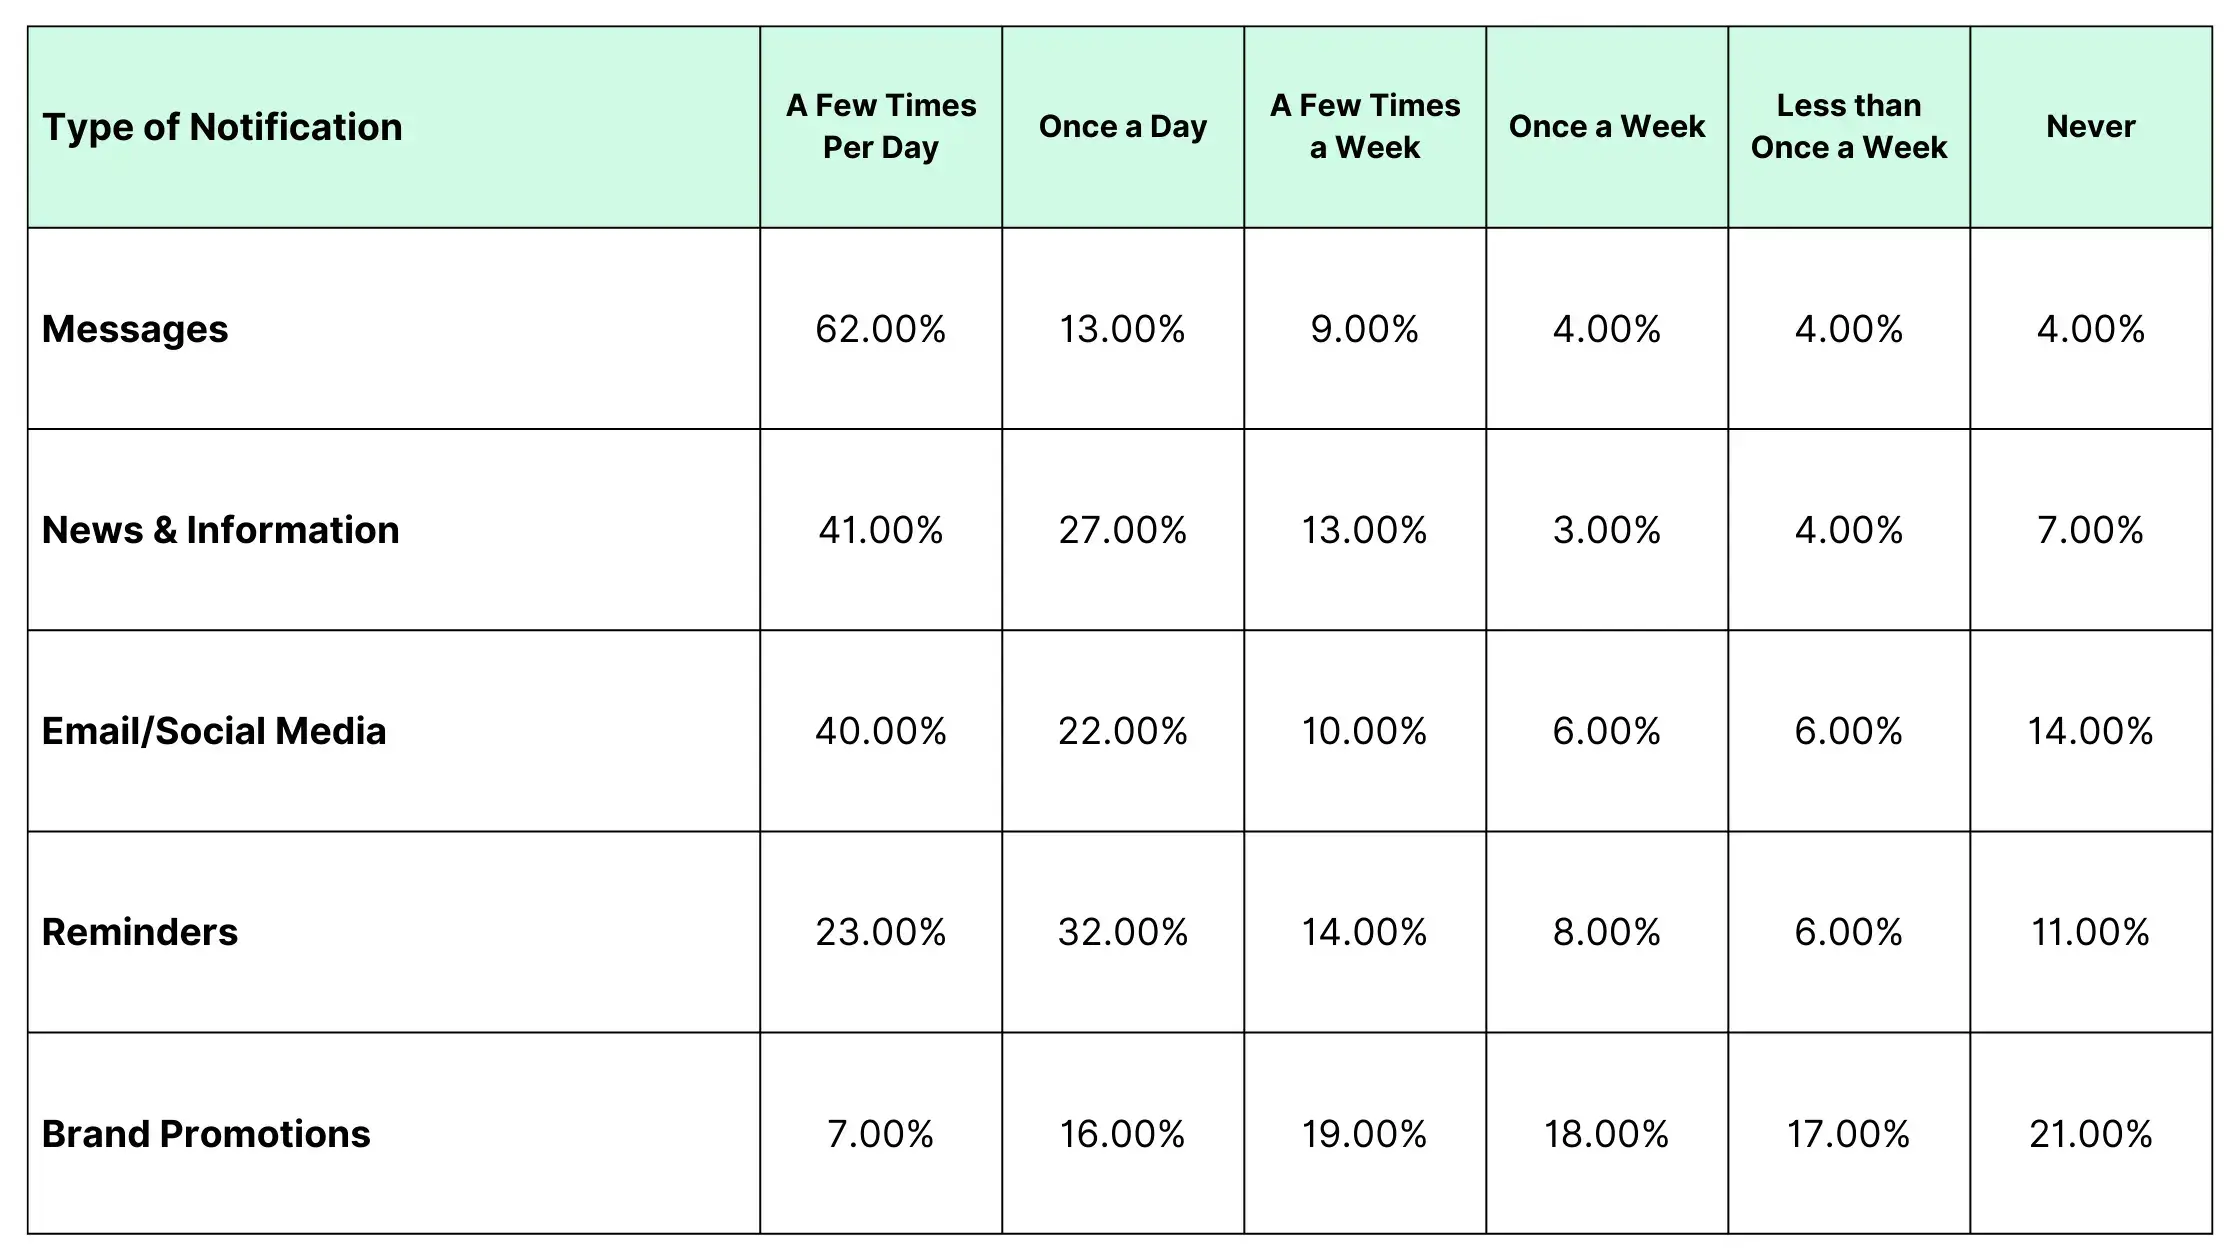
- 75% of app users say it’s appropriate to push notifications from messaging apps daily or multiple times per day.
- 68% of users say they are ok with receiving news and information notifications at the same frequency.
Users expect notifications for brand promotions less often – but that’s not to say never.
- 60% of app users believe it’s appropriate to receive notifications from brands once a week or more.
- 16% say they are ok receiving notifications from brands once a day, and 7% are fine with receiving these notifications multiple times per day.
On top of this, the data shared in the previous section showed that app retention rates are significantly higher for apps that send push notifications regularly, even as much as multiple times per day.
So as long as your notifications deliver some form of value to the user, you shouldn't be scared of sending regular push campaigns.
How to Craft Effective Push Notifications
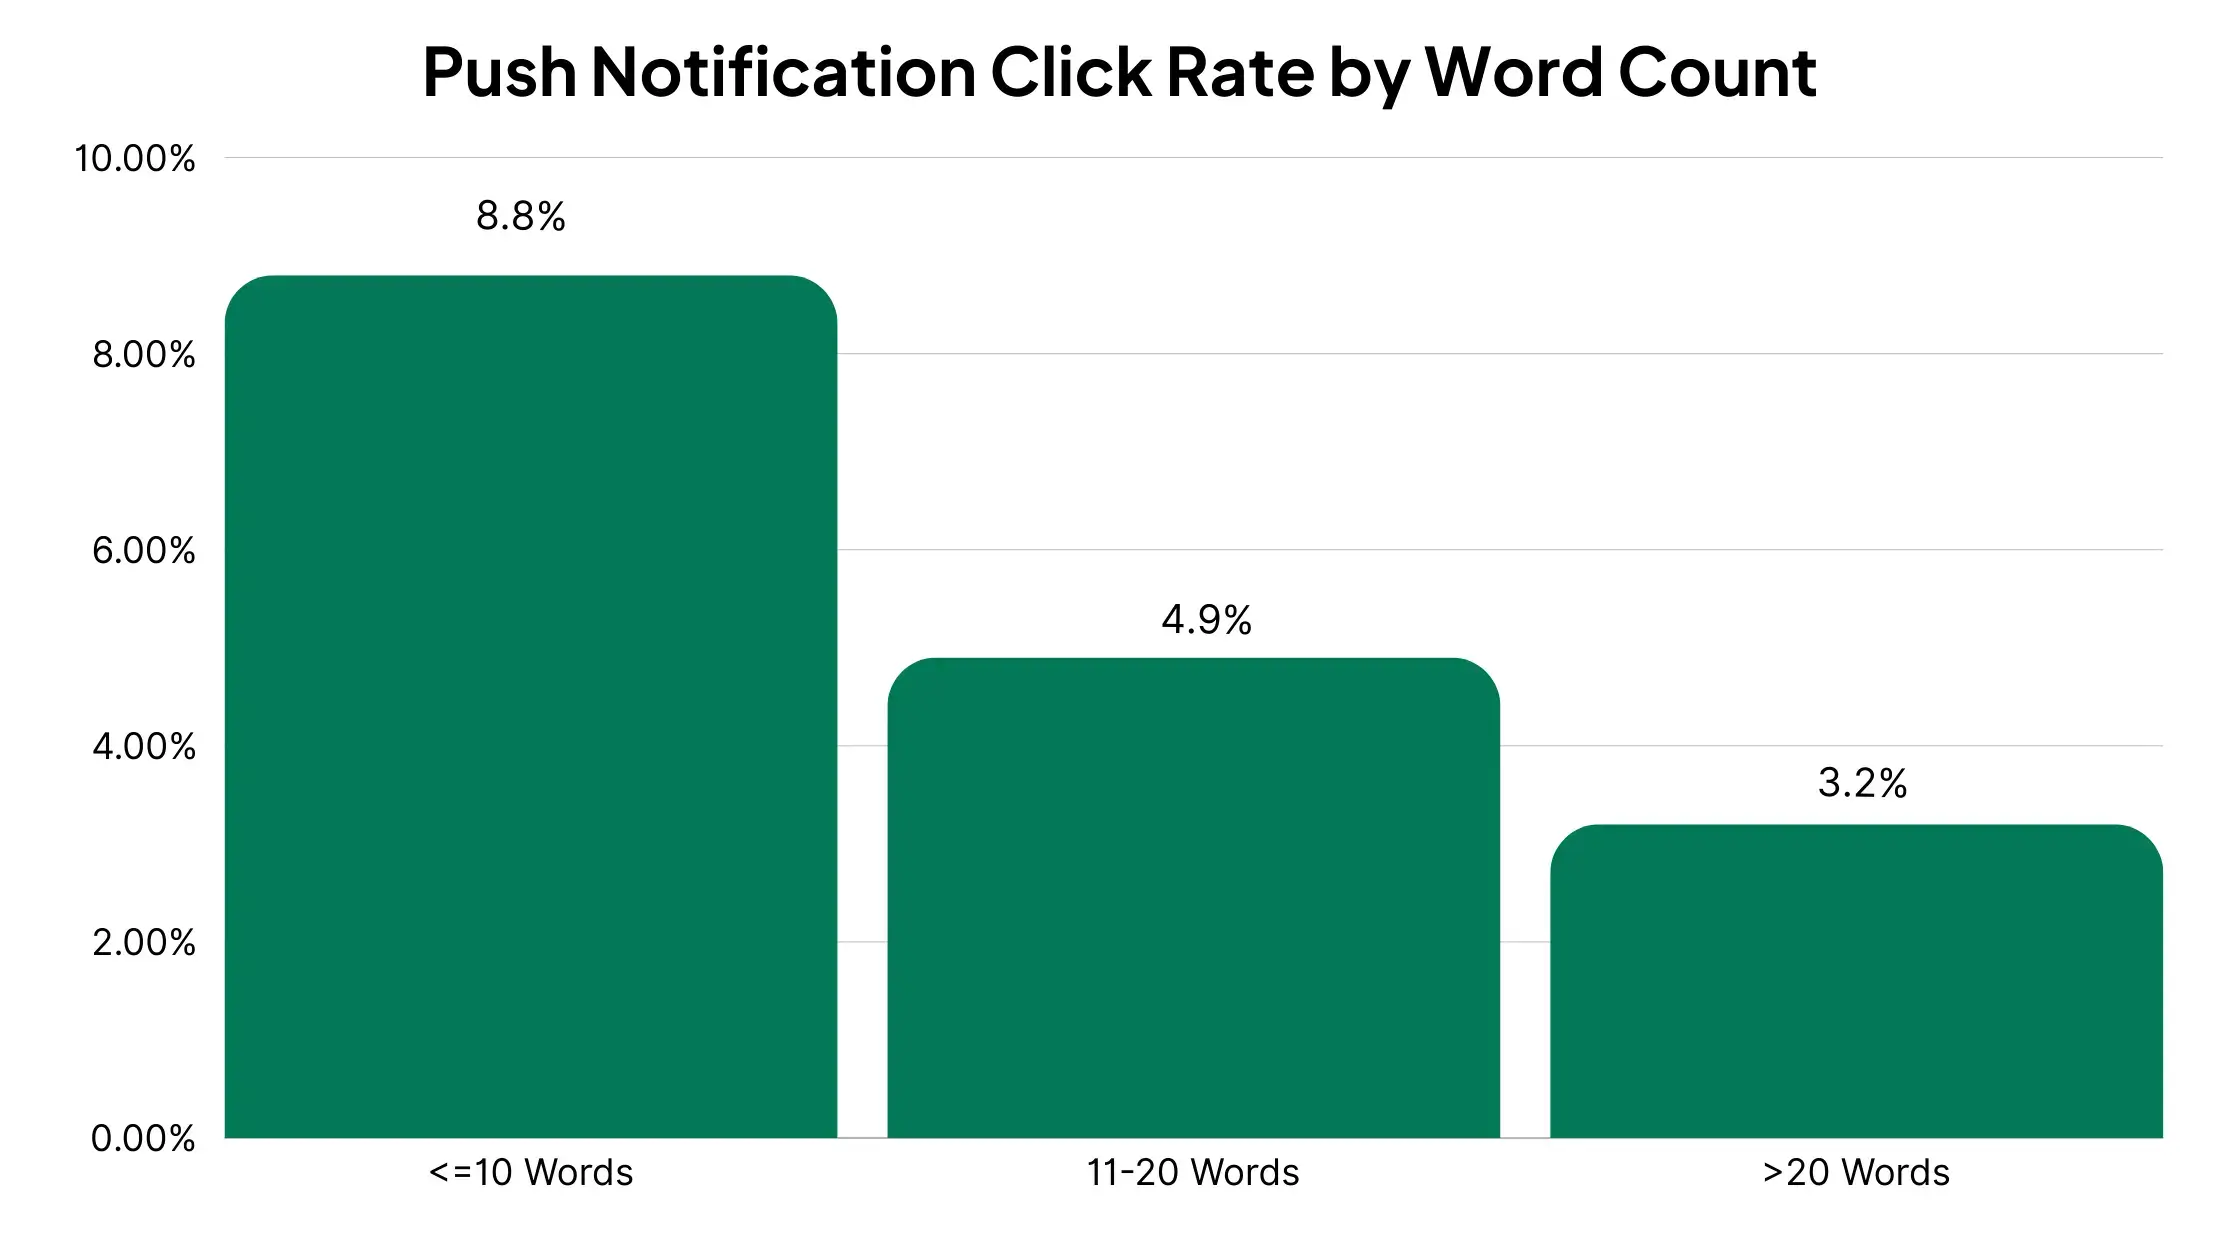
Data suggests that short, snappy push notifications are best.
A Localytics study found that push notifications with 10 or fewer words had nearly twice the click rate as those with 11-20 words, and nearly 3x the click rate of those with more than 20 words.
And Airship’s study of 50 billion push notifications found that certain features make it more likely for users to react to your push notifications.
- Emojis in push notifications increase reaction rates by 20%.
- Rich media (images, GIFs and videos) increase click rates by 25%.
- Personalized notifications (e.g. including the user’s name) have 4x higher reaction rates.
- Advanced targeting (e.g. using data based on preferences, behavior, location) increases retention rates up to 3x.
- A/B testing the sending time can increase reaction rates by 40%.
Of course, you’re going to get better engagement from your push notifications if you send the kind of content that users want.
A Localytics survey asked users what kind of push notifications they most wanted to receive.
- 48% wanted special offers based on their preferences.
- 35% wanted to see breaking news alerts.
- 34% wanted new content based on their preferences.
- 34% wanted special offers based on their location.
In terms of timing, most brands send push notifications during the week – you’ll want to test and see if this is right for your brand as well.
CleverTap studied 301 billion push notifications, and found the following trends:
- 77% of push notifications are sent between Monday and Friday.
- 17% of push notifications are sent on Fridays, making it the most popular day of the week for push.
- Sunday is the least popular, with 10% of all push notifications sent on this day.
- The most popular times to send push notifications are between 6-8am and 10pm-midnight.
For retail brands, morning and evening are the most effective times to send push notifications, and earlier in the week is better.
- Retail apps get the best CTR from push notifications when sent between 8-9am or between 6-8pm.
- The lowest CTR is between 4-5pm.
- Monday and Tuesday are the days of the week with the highest CTR, while Saturday is the lowest.
More Push Notification Stats: Quick Hits
We’ve already gone through a trove of data on push notifications, looking at average engagement rates, opt-in rates, frequency, consumer behavior and more.
Let’s cap it off with some more interesting push notification statistics we’ve dug up around the internet:
- Rich push notifications average a 56% higher open rate. [Airship]
- 46% of users will opt out of push if they receive 2-5 messages in one week.
- 32% of users will opt out if they receive 6-10 messages in one week. [Localytics]
- Push notifications have an average conversion rate of 4.4%.
- The average app user receives 46 push notifications per day.
- 77% of people say they have engaged with a push notification in the last month.
- 48% say they have made a purchase as a result of getting a push notification.
- 60% of app users say that push notifications make them use an app more frequently.
- Transactional push notifications have an average open rate of 69%.
- 43% of app users say that push notifications are less intrusive than email or SMS. [Gitnux]
- 29% of push notification campaigns use emojis.
- The most popular emojis used in push notifications are the fire emoji 🔥, pizza 🍕, thumbs up 👍, hourglass ⏳ and blue heart 💙. [CleverTap]
Final Thoughts
Push notifications are the new wave of brand-consumer communication.
Email, though not dead, can be impersonal, and emails can be easy to miss or ignore. SMS is direct and personal, but is rigid and inflexible.
Push notifications are personal, direct, customizable, and offer the least amount of friction of any communication channel.
Just one tap from their home screen and a user can be in the app. Push notifications are also a great way to stay top of mind, when you light up a user’s screen with a friendly message from your brand.
Any modern brand should be using push notifications. They’re an incredible tool for many use cases, from sending new product offers and promotions, to order updates and abandoned cart notifications.
To make the most of push notifications, you’ll need an app – and if you don’t already, MobiLoud is the best way to turn your existing website into an app, with push notifications built in, out of the box.

Click here to learn more about how easy it is to launch a mobile app for your eCommerce store, and click here to learn about how we integrate push notifications in your app.
If you’re ready to chat further, get a free demo now, and start using push notifications to grow your brand.
Sources
https://customer.io/blog/how-to-measure-push-performance-hint-its-not-open-rates/
https://www.statista.com/statistics/1050365/distribution-of-push-notifications-us-smartphone-users/
https://today.yougov.com/technology/articles/36287-how-consumers-feel-about-push-notifications-2021
https://uplandsoftware.com/localytics/resources/blog/ideal-push-message-length/
FAQs
Convert your website into a mobile app