40+ Mobile Commerce Statistics (2026): Sales, Trends, and Market Data

Mobile commerce hit $2.51 trillion in 2025. In the US alone, mobile now accounts for 44.6% of all ecommerce sales. During the 2025 holiday season, mobile crossed the 60% threshold for the first time on Thanksgiving Day. The trajectory is clear: mobile has become the default way people shop online.
Mobile commerce hit $2.51 trillion in 2025. In the US alone, mobile now accounts for 44.6% of all ecommerce sales. During the 2025 holiday season, mobile crossed the 60% threshold for the first time on Thanksgiving Day. The trajectory is clear: mobile has become the default way people shop online.
Mobile commerce is no longer an emerging trend. It's how most of the world shops.
But the data landscape is messy. Stats get recycled from outdated reports, sourced from aggregator sites, or stripped of context. This article pulls together the most current, verifiable mobile commerce data available, sourced directly from Statista, eMarketer, Adobe Analytics, Sensor Tower, and other primary research.
We update this page regularly. All figures include their source and year so you can cite them with confidence.
Want weekly insights into how 8 and 9-figure brands are driving sustainable growth? That's what you get with our value-packed newsletter, The Retention Edge. Subscribe for free today.
What Is Mobile Commerce?
Mobile commerce (m-commerce, or mCommerce) refers to any commercial transaction completed on a mobile device, typically a smartphone or tablet. This includes purchasing products through a mobile browser or app, mobile banking, mobile payments, and digital wallet transactions.
For the purposes of this article, we focus primarily on retail mobile commerce: people buying products and services on their phones.
Our Top Curated Mobile Commerce Statistics
Data is the best way to understand a growing market, trend or phenomenon. That’s why we’ve trawled through a number of sources to come up with the best pieces of data that explain the state of mobile commerce today.
Here are our top m-commerce statistics, along with an explanation for what these data points mean in context.
US Mobile Commerce Sales
US mobile commerce nearly tripled between 2019 and 2024, from $221 billion to $564 billion. By 2027, it's projected to approach $860 billion.
It's grown from a niche channel to a half-trillion-dollar market in under a decade.

Mobile Commerce as a Share of US Ecommerce
Mobile's share of total US ecommerce sales has also been climbing steadily:
The US is closing in on the tipping point where mobile accounts for more than half of all online sales. Holiday shopping data (which we've also covered below) suggests it may get there sooner than projected.
Mobile Commerce as a Share of US Total Retail
Looking at all retail sales (including brick-and-mortar), mobile commerce still represents a smaller but fast-growing slice:
- 2022: 6.9% of total US retail sales
- 2024: 7.4% of total US retail sales (Statista)
- 2025: 10.4% of total US retail sales (Statista)
For reference, total US ecommerce (desktop + mobile) accounted for 16.1% of all retail sales in 2024 (US Census Bureau). Mobile alone is projected to surpass 10% for the first time in 2025.
Global Mobile Commerce Sales
The global picture is even more mobile-dominated, driven by markets in Asia-Pacific where mobile-first shopping is the norm.
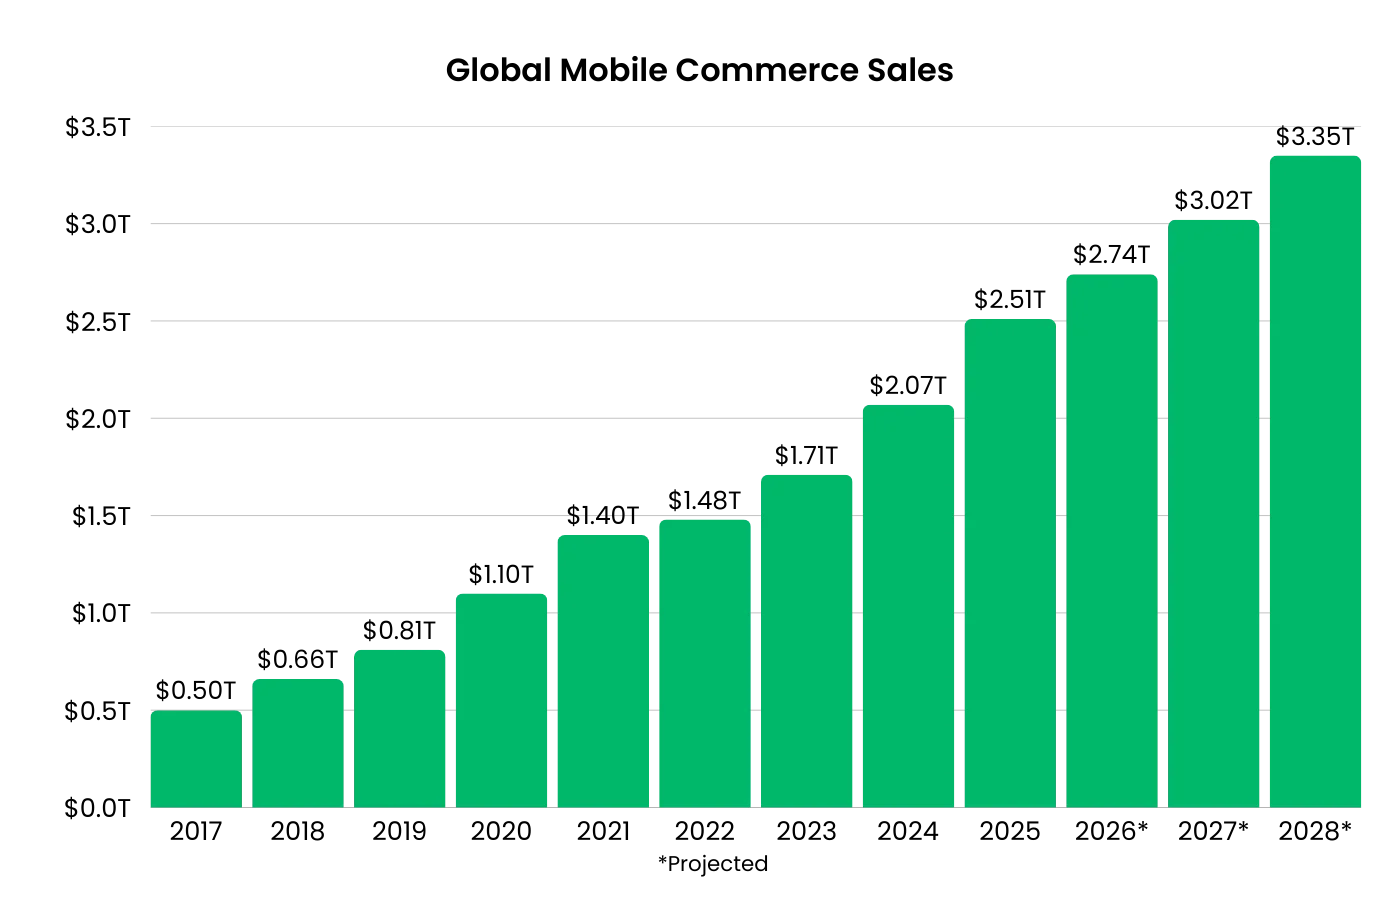

Global mobile commerce has more than quadrupled since 2017. The average annual growth rate from 2017 to 2028 is projected at 19.2%.
Note the dip in 2022 growth (+5.7%), likely a normalization after the pandemic-fueled acceleration of 2020-2021, followed by a strong rebound in 2023-2024.
Mobile Commerce as a Share of Global Ecommerce

A key detail: the US significantly lags the global average. While mobile accounts for 57% of ecommerce globally, it's only 44.6% in the US. Markets in Asia-Pacific are well above 60%.
This suggests the US has significant room for mobile commerce growth.
Mobile app users spend more, shop more frequently, and are more loyal to your brand. Use our Ecommerce App Revenue Calculator to see just how much you stand to gain by launching an app.
Mobile Dominates Ecommerce Traffic
One of the most important dynamics in mobile commerce is the gap between traffic and transactions.
- 75-77% of all ecommerce website traffic comes from mobile devices (Statista, SimilarWeb)
- During the 2024 holiday season, mobile accounted for 79% of global retail site traffic (Salesforce Shopping Index)
But Mobile Converts Lower Than Desktop
Despite dominating traffic, mobile lags behind desktop on conversion rates:
- Mobile conversion rate: ~2.0%
- Desktop conversion rate: ~3.0-3.9%
Sources: eMarketer, Smart Insights
Desktop consistently converts 1.5 to 2x higher than mobile web. The result: mobile drives three-quarters of visits but a smaller share of revenue. This traffic-to-conversion gap is one of the central challenges in ecommerce today.
Global Web Traffic by Device
Looking at all web traffic (not just ecommerce), here's the share of mobile vs desktop traffic:
- Global: 62-64% mobile, ~35% desktop, ~2% tablet (Statcounter, Jan 2026)
- US: 43% mobile, 57% desktop (Statcounter)
- UK: 54% mobile, 46% desktop
- Canada: 47% mobile, 53% desktop
The US is notably desktop-heavy compared to the global average, likely due to higher rates of laptop/desktop ownership and workplace browsing.
Key Holiday Mobile Stats
The 2025 holiday season provided some of the strongest evidence yet that mobile commerce is becoming the default shopping channel. Adobe Analytics, which tracks over 1 trillion visits to US retail sites, reported record mobile penetration across every major shopping day.
- Full holiday season (Nov 1 - Dec 31): Mobile was 56.4% of all online sales, up from 54.5% in 2024 (Adobe)
- Thanksgiving 2025: Mobile crossed 60% for the first time, reaching 61.6% of online sales
- Black Friday 2025: Mobile drove 52-57% of purchases; total online sales hit a record $11.8 billion (Adobe via Nasdaq)
- Cyber Monday 2025: Mobile was 57.5% of online sales; total hit $14.25 billion (a record) (Adobe)
- Christmas Day 2025: The highest mobile penetration of the season at 66.5% of online sales
The total holiday online spend reached $257.8 billion, up 6.8% year-over-year.
Check out more Black Friday Statistics here.
BNPL on Mobile
Buy Now, Pay Later saw massive mobile adoption during the 2025 holidays. Smartphones drove 82.2% of all BNPL purchases during the season, reinforcing that impulse and flexible-payment purchases are overwhelmingly mobile-first (Adobe).
Mobile App vs Mobile Web Stats
Not all mobile commerce is equal. There's a significant performance gap between shopping in a native app versus a mobile browser.
Conversion Rates
- Mobile apps convert at approximately 3.5%, compared to ~2% for mobile web, roughly 3x higher (BuildFire, Criteo)
- App users view 286% more products per session than mobile web users (22 vs. 5.7 products) (Criteo)
Engagement
- Shoppers spend 201.8 minutes per month in shopping apps vs. 10.9 minutes on mobile shopping websites (data.ai). That's roughly 18x more time.
- Globally, consumers spent 41.9 billion hours in shopping apps in 2024, up 7.4% year-over-year (Sensor Tower)
Revenue Split
- 54% of all mobile commerce transactions happen in apps, compared to 46% via mobile browsers (JP Morgan)
- Average order value in apps: ~$95, compared to ~$73 on mobile web (industry benchmarks)
Shopping App Growth
- Shopping app installs grew 70% overall and 123% on iOS in 2025 (AppsFlyer)
- 69.4% of internet users have shopping apps on their phones (Datareportal)
- 70% of mobile purchases occur through ecommerce apps rather than mobile browsers (DemandSage)
Mobile Payments and Digital Wallets
Mobile payments have gone mainstream. Digital wallets are now the most popular online payment method globally.
- Digital wallets account for 53% of global online purchases (Statista)
- Digital wallets handle 31% of in-store transactions globally, and growing
- Apple Pay: 60 million US users (21.2% of the population) in 2024, projected 63.9 million in 2025; 744 million users globally (Chargeflow)
- Google Wallet: 48.59 million US users (14.5%) in 2024, projected 50.94 million in 2025 (Chargeflow)
- 27% of US consumers used mobile wallets on Cyber Monday 2025 (Adobe)
Mobile Shopper Demographics
How Many People Shop on Mobile?
- Globally: Approximately 1.65 billion people will shop on mobile devices in 2025 (Statista)
- US: Over 200 million adults (76% of the adult population) have made a purchase on their smartphone (Shopify)
- US weekly: 32% of US adults shop on their smartphone at least weekly (Shopify)
- Global weekly: 29.9% of online shoppers purchase on mobile weekly (Statista)
Who Shops on Mobile?
- 92% of mobile shoppers in the US are under 50 years old (Shopify)
- 73% of consumers say they prefer shopping on their phone (Cropink via DemandSage)
Three out of four consumers say they buy on mobile to save time (Dynamic Yield)
The Mobile UX Problem
Despite the growth in mobile shopping, the experience still has friction:
- Only 12% of consumers find mobile web shopping "convenient" (Dynamic Yield)
- 67% of mobile shoppers cite "pages and links too small to click" as a barrier (Dynamic Yield)
- 57% of consumers won't recommend a business with a poorly designed mobile site (Sweor)
- Mobile cart abandonment sits at roughly 78-83%, compared to 67-70% on desktop (XP², SaleCycle, Contentsquare)
That gap, roughly 10 percentage points, adds up fast at scale. If your mobile checkout converts even a few percent lower than desktop, you're leaving significant revenue on the table given that mobile accounts for 75%+ of your traffic.
Mobile App Market and Usage
Time Spent in Apps
- Consumers spent 5.3 trillion hours on mobile apps in 2025, up 3.8% year-over-year (Sensor Tower)
- The average user spends 3.6 hours per day in apps globally (Sensor Tower)
- In the US, smartphone users average 5 hours 16 minutes per day on their devices (Backlinko)
- 94% of mobile time is spent in apps; only 6% is in browsers (Sensor Tower)
App Revenue
- Global in-app purchase revenue reached $167 billion in 2025, up 10.6% year-over-year (Sensor Tower)
- For the first time, non-gaming apps ($85.6 billion) surpassed gaming apps ($81.8 billion) in consumer spending (Sensor Tower)
- US consumers alone spent approximately $60 billion on apps in 2025 (Sensor Tower)
Mobile App Market Size
- The global mobile app market is estimated at $300-330 billion in 2025 (Precedence Research, Fortune Business Insights)
- Projected CAGR: 13-15% through 2033-2035
- Asia-Pacific represents the largest regional market at approximately 33% of global revenue (Precedence Research)
What This Means for Ecommerce Brands
The data tells a clear story - mobile is the #1 priority channel for today’s ecommerce brands.
- Mobile dominates your traffic. Three-quarters of your ecommerce visitors are on their phones. During holidays, it's closer to 80%. But if you’re plugged in, you’ll already know this.
- Mobile web underperforms. Conversion rates are half of desktop. Cart abandonment is higher. Only 12% of shoppers find the mobile web experience convenient.
- Native apps close the gap. Apps convert 3x higher than mobile web, see 18x more engagement time, and reduce cart abandonment rates. More than half of all mobile commerce transactions already happen in apps.
The brands that are capturing mobile revenue aren't just optimizing their websites for smaller screens. They're meeting customers in native apps, where the shopping experience is faster, stickier, and far more likely to convert.
Your Mobile Commerce Strategy for 2026
For ecommerce brands looking to capture the most revenue from their mobile-first customers, here’s what you need to be building:
- Mobile-first customer experiences. Assume the person landing on your website is doing so on their phone.
- Checkout built for mobile. Mobile cart abandonment is higher largely due to friction in the checkout. Remove this friction; make it mobile-friendly.
- Mobile-first content and merchandising. Your product pages, landing pages, and promotional content should be designed for the phone screen first, not adapted from desktop.
- Communication and marketing that makes sense on mobile. Email, SMS, push - social ads and influencer marketing built around discovery and conversions on mobile.
- Native mobile apps. The best mobile UX bypasses the browser completely, and gives your brand valuable real estate on the customer’s home screen.
MobiLoud helps you extend your website into a native app, giving you a powerful owned channel, built for mobile-first shoppers.
It's the risk-free way to launch a mobile app, with no dev team needed, no rebuilding, no managing a new platform parallel to your website.
MobiLoud has helped over 2,000 businesses, including many high-revenue ecommerce brands, launch their own mobile apps. Want to join them? Book a free strategy call to see if a mobile app is the logical move for your brand.
FAQs
Convert your website into a mobile app