Android vs iOS Market Share: Most Popular Mobile OS in 2026

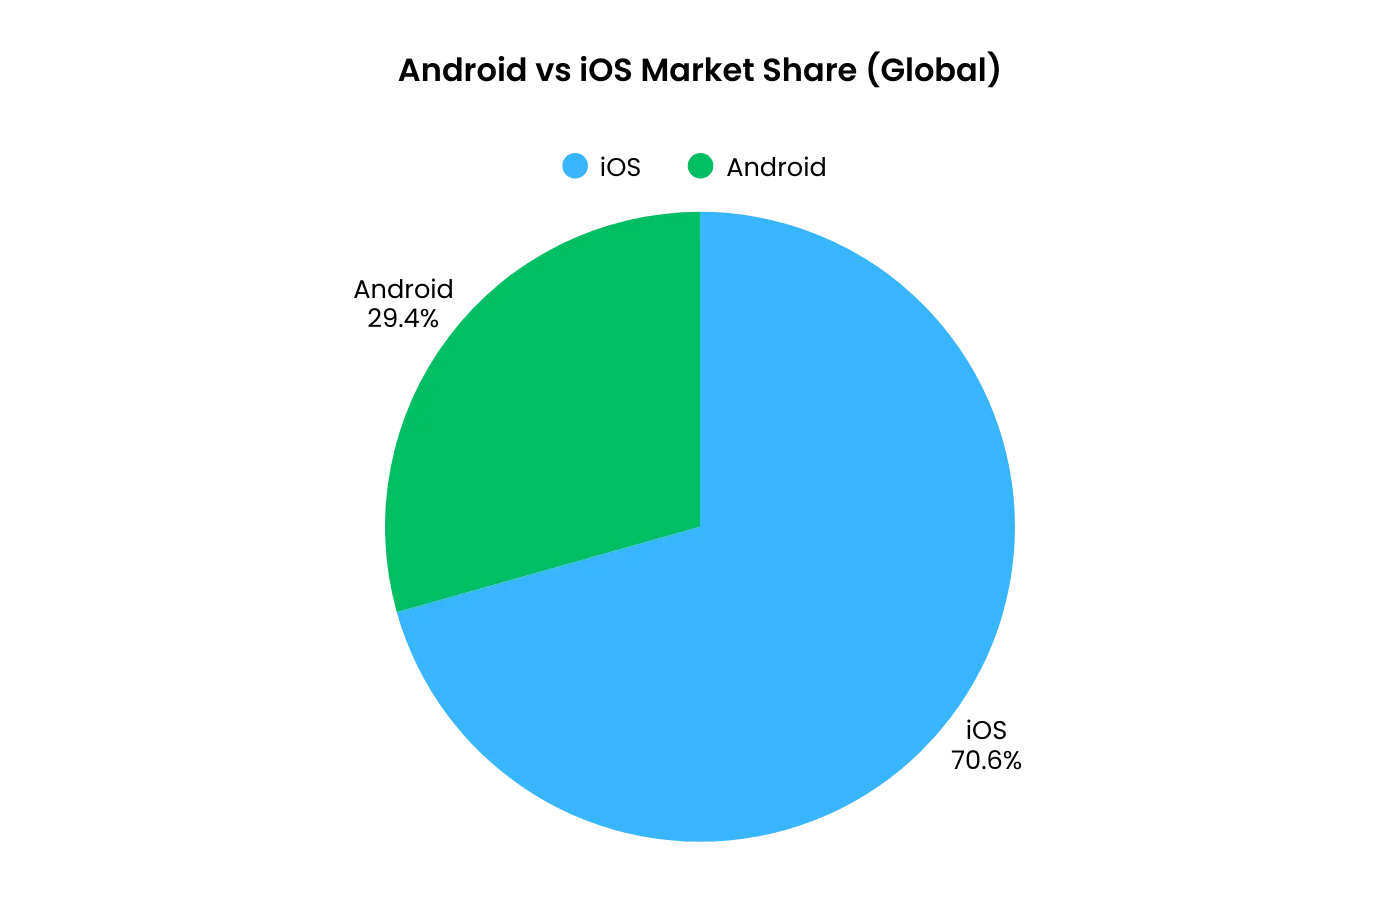
Android controls about 70% of the global smartphone market, while iOS holds roughly 29%. But the revenue picture is reversed: iOS generates around 70% of all app consumer spending. If you're building a mobile app for your business, the answer is simple: you need both platforms.
Android controls about 70% of the global smartphone market, while iOS holds roughly 29%. But the revenue picture is reversed: iOS generates around 70% of all app consumer spending. If you're building a mobile app for your business, the answer is simple: you need both platforms.
The smartphone market is a two-player game.
Android and iOS together account for over 99% of all mobile devices worldwide. Every other mobile operating system is either dead or statistically irrelevant.
So which platform is actually winning? That depends on what you're measuring.
In this guide, we break down the latest market share data across regions, countries, app stores, and revenue to give you the full picture for 2026.
Want to launch an app, but not sure which platform to build it for? With MobiLoud, you can easily launch apps for both iOS and Android, with no extra lift. Click here to learn more about how we can help you launch the perfect iOS and Android apps.
Android vs iPhone Market Share: Which Smartphone OS Is More Popular?
According to StatCounter data, Android holds a 70.36% global market share compared to iPhone's 29.25%.
In raw numbers, that translates to approximately 3.9 billion Android users versus 1.56 billion iPhone users worldwide.
There are roughly 4.7 billion smartphone users globally, though the total number of active smartphone devices is higher (over 7 billion) since many people own more than one device.
Android's dominance comes primarily from its availability across hundreds of manufacturers at every price point. Samsung leads with about 31% of the Android vendor market, followed by Xiaomi (16%), Vivo (11%), and Oppo (10%). Apple, of course, is the sole manufacturer of iOS devices.
Key Android vs iOS Statistics
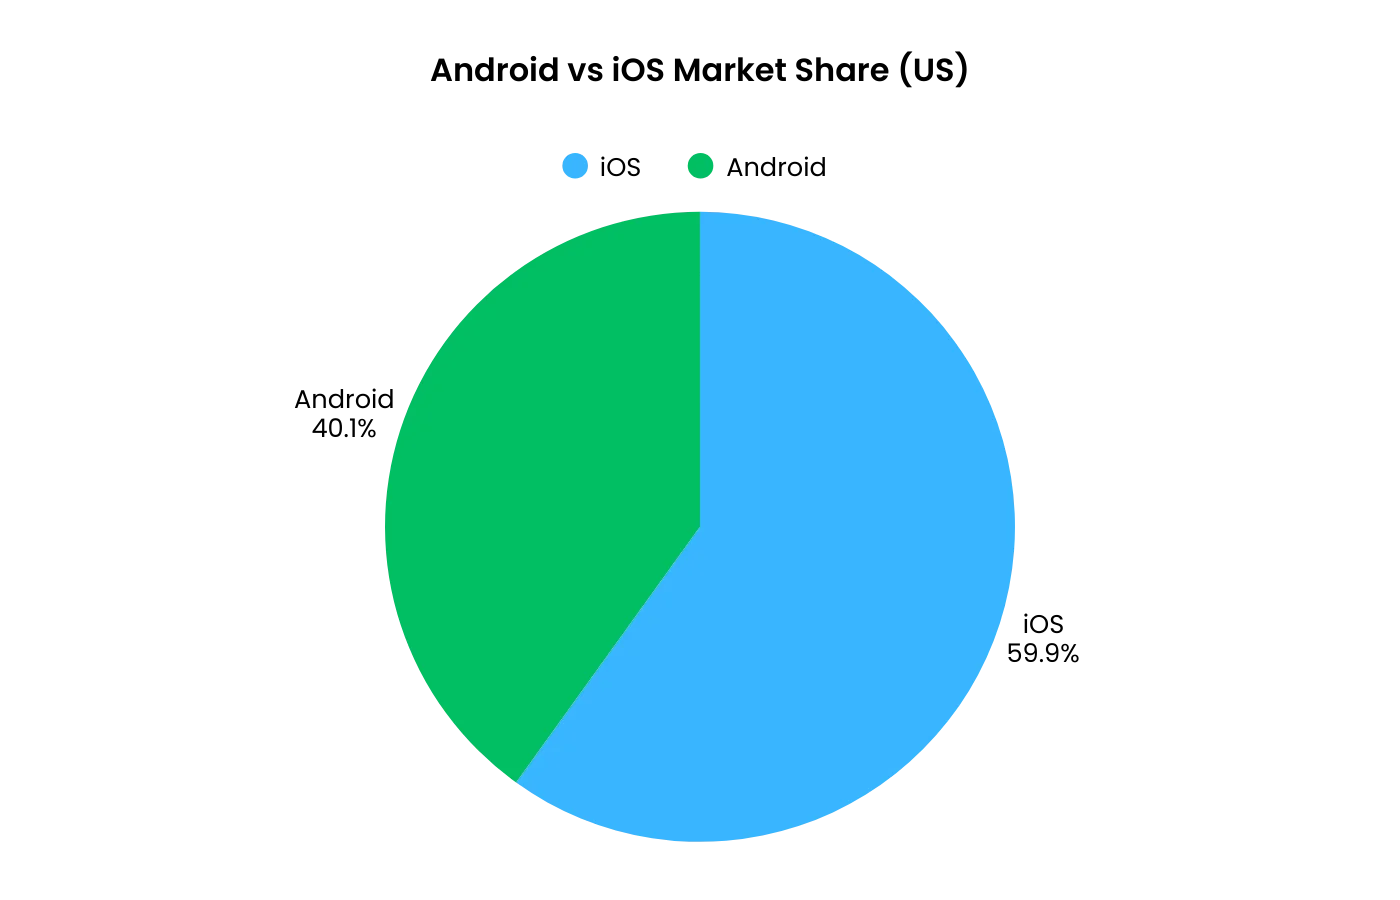
In the US, the market share data flips: iOS is the clear winner with nearly 60% of the market.
Let's dive into more Android vs iOS statistics now.
Market Share by Country
The split between Android and iOS varies significantly by country. In wealthier markets, iOS tends to lead or run close to even. In emerging markets, Android dominates by wide margins.
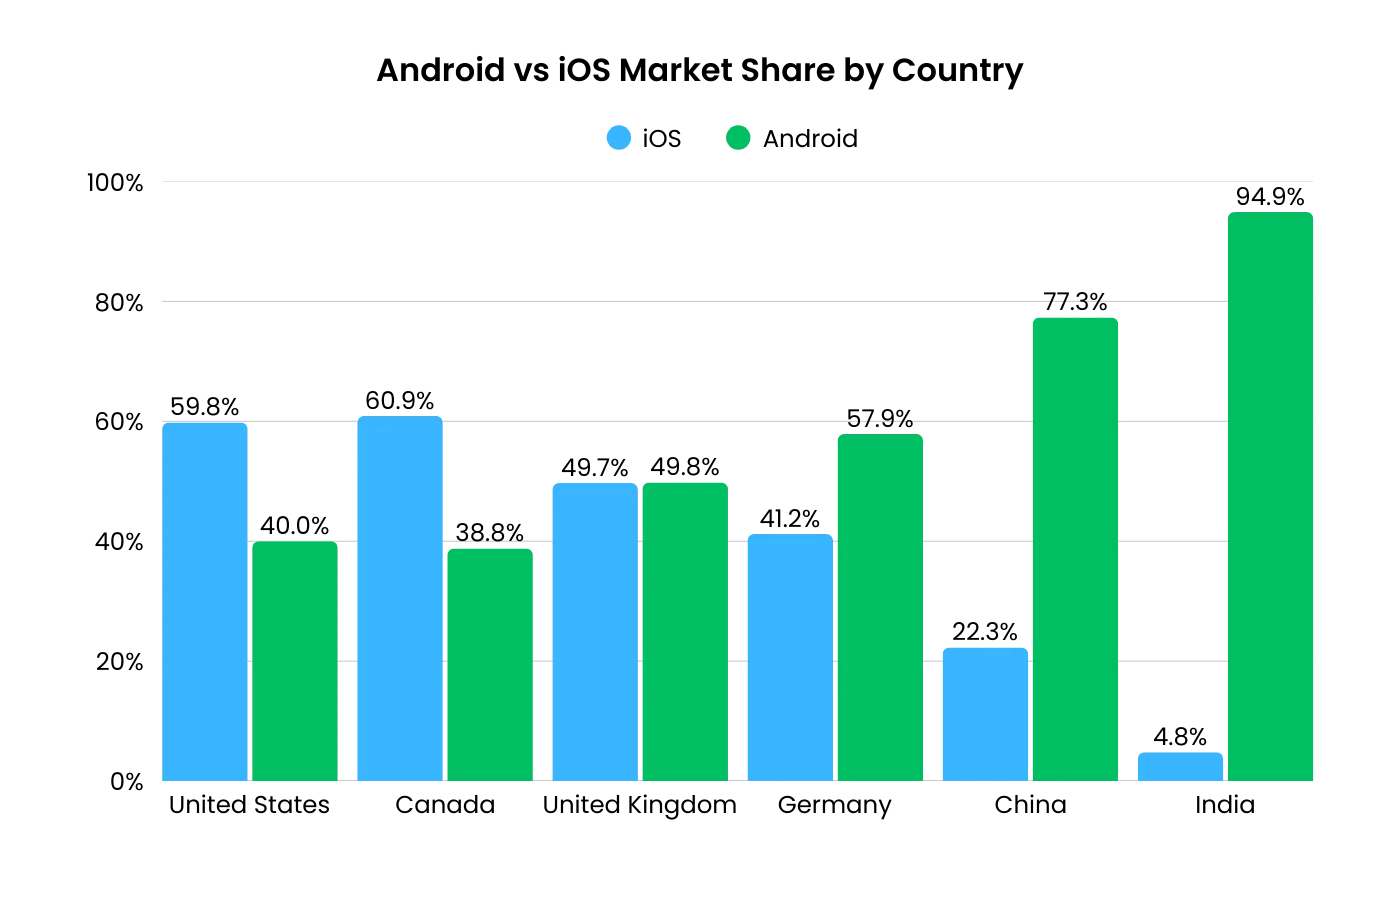
Source: StatCounter
A few things stand out.
- The US and Canada remain strong iOS markets, with Apple holding roughly 60% in both countries.
- The UK is now essentially a coin flip, with Android and iOS virtually tied at just under 50% each.
- In India, Android's dominance is nearly total at 95%.
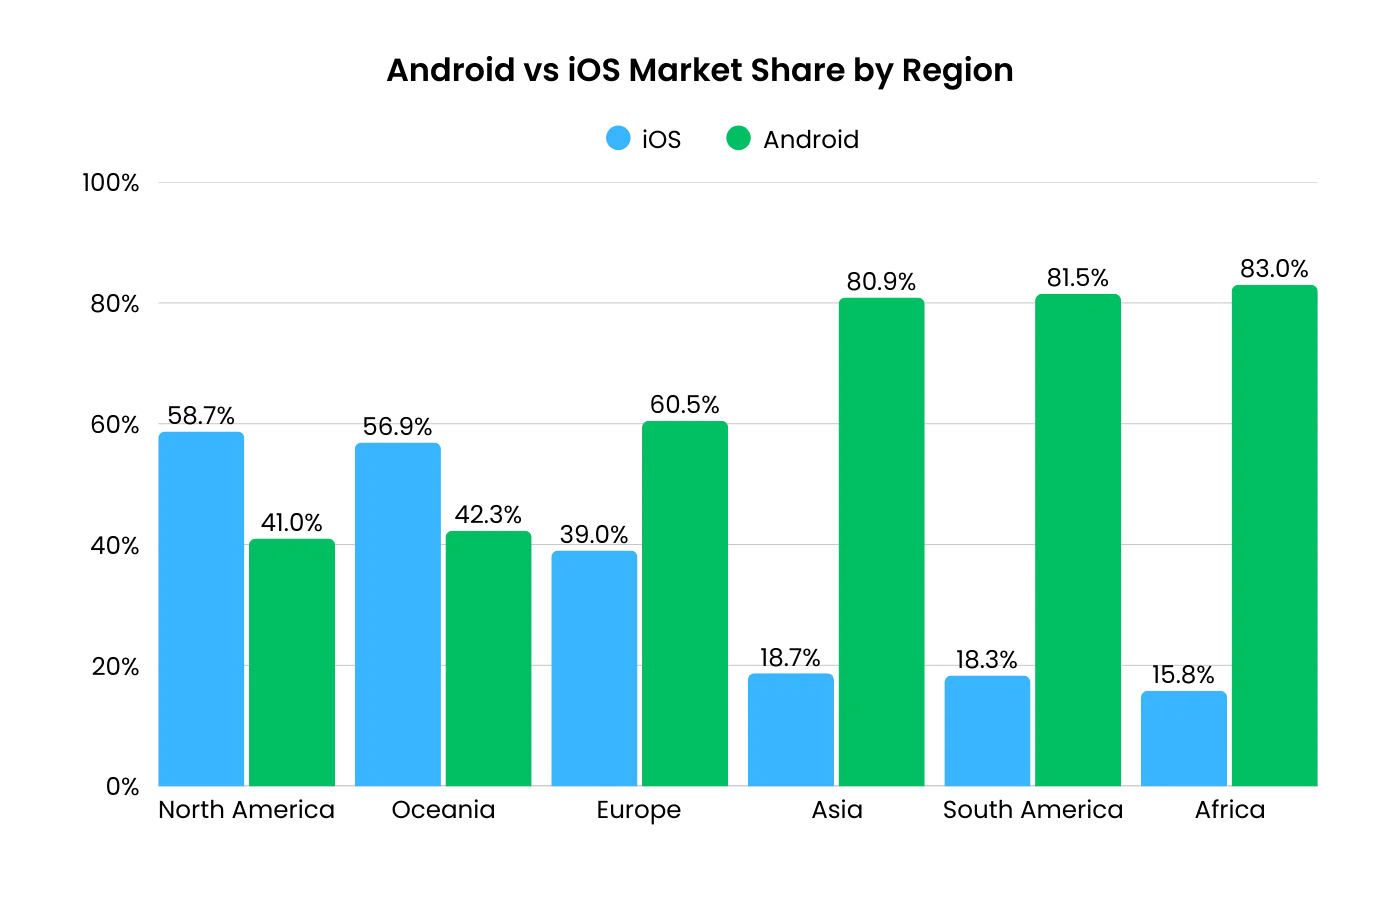
Market Share by Continent
Zooming out to a continental level, the pattern is clear: iOS leads in North America and Oceania, while Android dominates everywhere else.
Source: StatCounter
One notable shift: Europe has moved significantly toward iOS over the past couple of years. iOS now holds 39% in Europe, up from around 33% previously.
That's a meaningful gain and reflects growing iPhone adoption across Western European markets.
Mobile Operating System Market Share: 2009 to Present
The smartphone market looks nothing like it did 15 years ago.
In 2009, the landscape was fragmented across Symbian, BlackBerry, Windows Mobile, and the early versions of iOS and Android.
Android didn't overtake iOS in global market share until 2012. By 2017, it had crossed 70% worldwide and has hovered in the 70-73% range ever since. iOS has remained stable in the 27-30% range during the same period.
Every other platform has effectively disappeared. Symbian is gone. BlackBerry is gone. Windows Phone is gone.
The market consolidated into a duopoly, and it's been that way for nearly a decade.
Mobile OS Market Share Trends in the US
The US is an exception to the global pattern. iPhone has been the dominant smartphone platform in America for years, and that hasn't changed.
As of 2026, iOS holds 59.8% of the US mobile market compared to Android's 40%.

That's remained relatively stable, fluctuating within a few percentage points year to year.
The reasons are partly economic (higher average incomes support premium device pricing), partly ecosystem-driven (iMessage, AirDrop, and Apple's integrated ecosystem create strong lock-in), and partly cultural. In the US, the iPhone is the default, especially among younger demographics.
Android vs iOS App Store Statistics
Both the Google Play Store and Apple App Store are massive, but the gap between them has narrowed significantly.
Source: 42matters
This is a big change from previous years. Google Play used to have roughly twice as many apps as Apple. That's no longer the case.
Google undertook a major cleanup effort, removing millions of low-quality and abandoned apps from the store. The result is that both stores now sit at roughly the same size, around 2.1-2.2 million apps.
The distribution of free vs paid apps is similar on both platforms, with free apps making up the vast majority.
Apple has a slightly higher percentage of paid apps (4.8% vs. 3.0%), which aligns with its user base's greater willingness to pay.
iOS vs Android Revenue Statistics
Despite Android's much larger install base, iOS generates significantly more revenue.
In 2025, total global consumer spending on mobile apps and games reached $155.8 billion, up 21.6% year-over-year. iOS accounted for approximately 70% of that spending.
Sources: Appfigures via Dataconomy, Business of Apps
There are a couple of things worth highlighting.
First, 2025 marked the first year that non-gaming apps generated more revenue than games.
Non-gaming spending hit $82.6 billion (up 33.9% year-over-year) while gaming came in at $72.2 billion. This is a significant shift from even just a few years ago when gaming dominated mobile revenue.
Second, subscription revenue has exploded.
At $79.5 billion, subscriptions now account for roughly half of all consumer spending on mobile apps. iOS users drive nearly three-quarters of that, which explains why the App Store remains so much more lucrative for developers despite having fewer users.
The bottom line: Android has the users, but iOS has the wallets. If you're building a business on mobile, you can't afford to ignore either platform.
Android vs iOS Market Share (Tablets)
The tablet market tells a slightly different story from smartphones. Apple's iPad still leads, and it's actually gained a bit of ground recently.
Source: StatCounter
Back in 2012, Apple controlled around 85% of the tablet market. Android tablets gradually chipped away at that lead throughout the 2010s.
But the current split of roughly 56/44 in Apple's favor has held fairly stable, and iPad has actually regained a few points recently.
Other Players in the Mobile OS Market
Beyond Android and iOS, there's not much left. Here's the complete breakdown of mobile operating systems according to StatCounter's data:
Source: StatCounter
It wasn't always this way. In 2012, Symbian, BlackBerry OS, Series 40, and Windows Phone all held meaningful market share. By 2026, every one of those platforms is gone.
The mobile OS market is a two-player game, and there's no realistic challenger on the horizon.
Samsung's Tizen still technically exists at 0.25%, primarily on older devices in specific markets. KaiOS, which powers basic feature phones, registers at 0.02%. Neither is relevant for app development or mobile strategy decisions.
Is It Better to Develop for Android or iPhone?
If you're deciding where to launch a mobile app for your business, the answer is straightforward: develop for both.
Android and iOS together represent over 99.6% of the global smartphone market. Choosing one platform means leaving a massive portion of potential users on the table.
If you go iOS-only, you're missing 70% of the world's smartphone users. If you go Android-only, you're missing the platform that generates 70% of app revenue.
The traditional barrier has been cost. Building native apps for both platforms means two separate codebases, two development teams, and double the maintenance. That's a significant investment, easily $100K+ for a custom build, plus ongoing costs.
That's where a different approach comes in.
Instead of building two separate apps from scratch, you can extend your existing website into native iOS and Android apps.
Your website already has your full product catalog, checkout flow, account management, and every integration you've set up. A native app built on top of your website inherits all of that, without rebuilding anything.
With MobiLoud, your website becomes a fully native mobile app on both platforms. You keep your entire existing tech stack. Every update you make to your website is instantly reflected in the app. And you unlock native features like push notifications, a home screen icon, and an App Store and Google Play presence, all without separate development projects.
We've built 2,000+ apps for brands across every major ecommerce platform, including Shopify, WooCommerce, Magento, Salesforce Commerce Cloud, and custom-built sites.
Curious whether a mobile app makes sense for your brand? Book a free strategy call to see your website as a native app. No commitment.
FAQs
Convert your website into a mobile app


.avif)